Voltmasters Platform
Algorithm dashboard
The Algorithm dashboard plots consumption, PV production, battery power and the algorithm's charge and discharge decisions against grid flows.
The Algorithm dashboard visualises how the energy management algorithm dispatches resources over time.
The charts plot consumption, PV production, battery power, and the algorithm's charging and discharging decisions, alongside grid power flows and other internal signals.
These views help evaluate algorithm performance and identify areas for improvement.
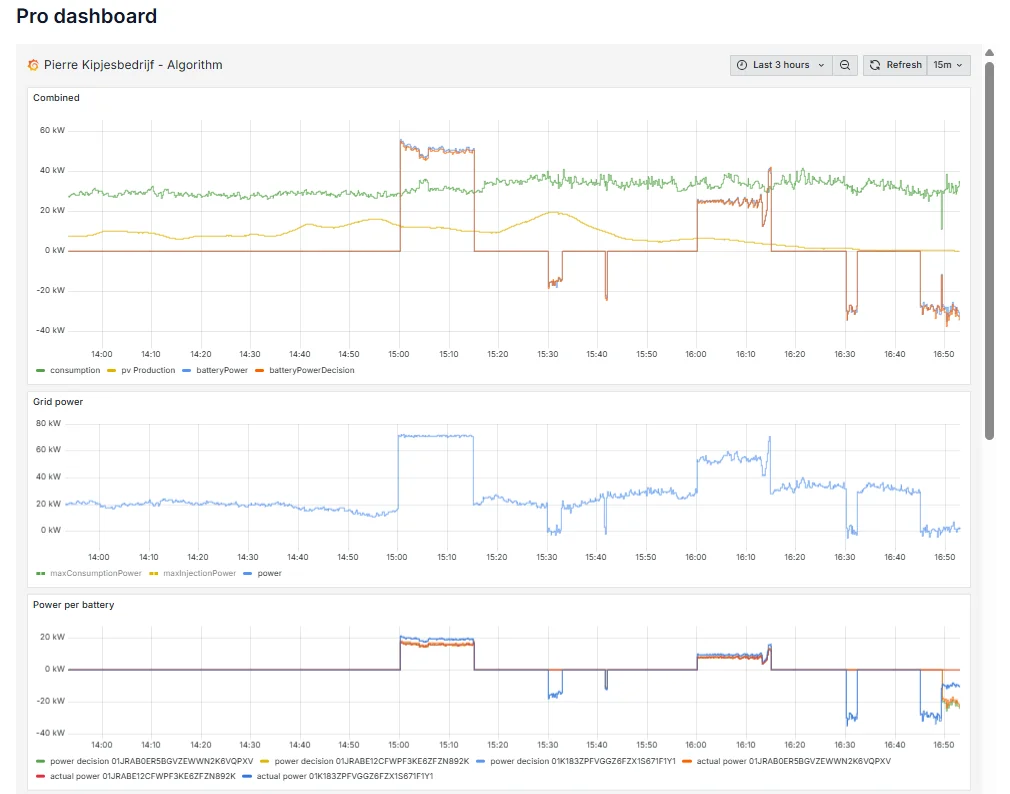
Voltmasters EMS: pro dashboard - algorithm
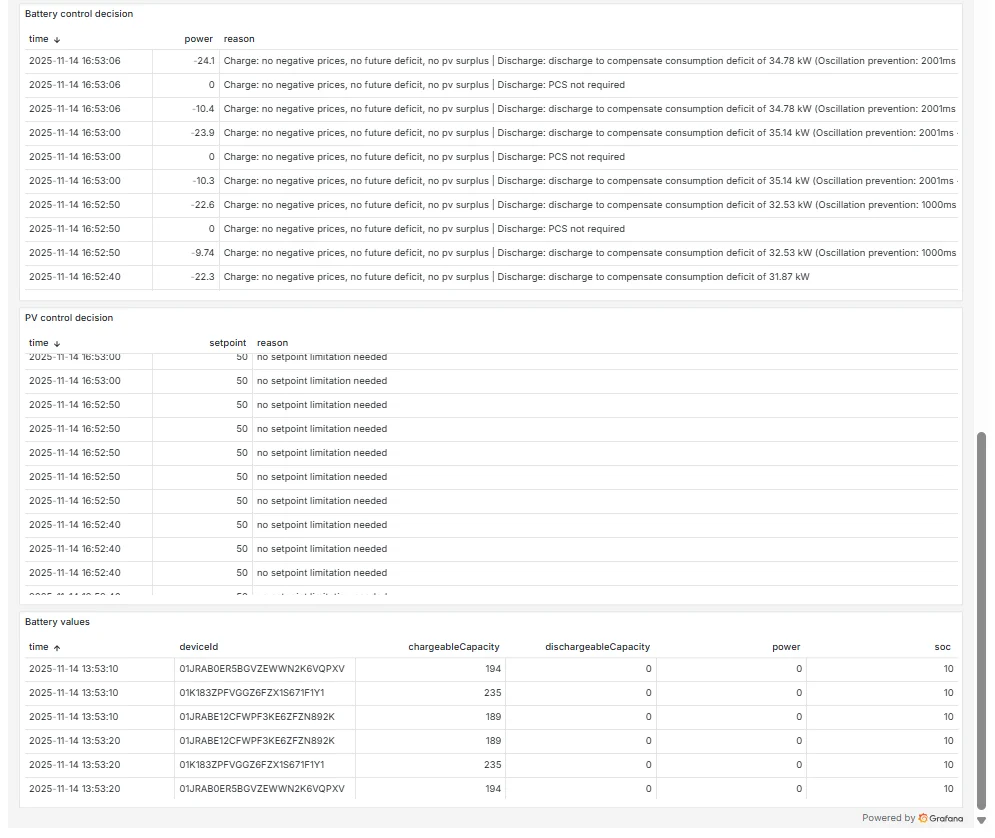
Voltmasters EMS: pro dashboard - decision feedback
Navigating the Pro Dashboard
How do I change the time period?
Use the period selector at the top of the screen to choose a specific day, week, or custom range.
How do I zoom in on a specific part of the graph?
Click and drag across a section of the graph to zoom in on that time range. Use the reset or zoom-out control to return to the full view.
What can I see on the different charts?
The charts shown depend on which Pro dashboard you have open:
| Dashboard | Content |
|---|---|
| Algorithm | Consumption, PV production, battery charge/discharge power, algorithm decisions, grid power and other internal signals |
| Energy trading | Imbalance prices, battery control set-points and actual vs. requested power (see 7.2) |
| EV Charging | EV charger load curves and session data (if EV chargers are connected) |
Frequently asked questions
Where can I find out why my battery charged or discharged at a specific time?
Open the Algorithm dashboard and select the relevant time period. The charts show the relationship between energy prices, PV production, consumption and the algorithm's resulting battery decisions. The decision feedback chart shows the active control mode (e.g., self-supply, cost optimisation, max import/export) at each point in time.