The platform
Your command centre for every project
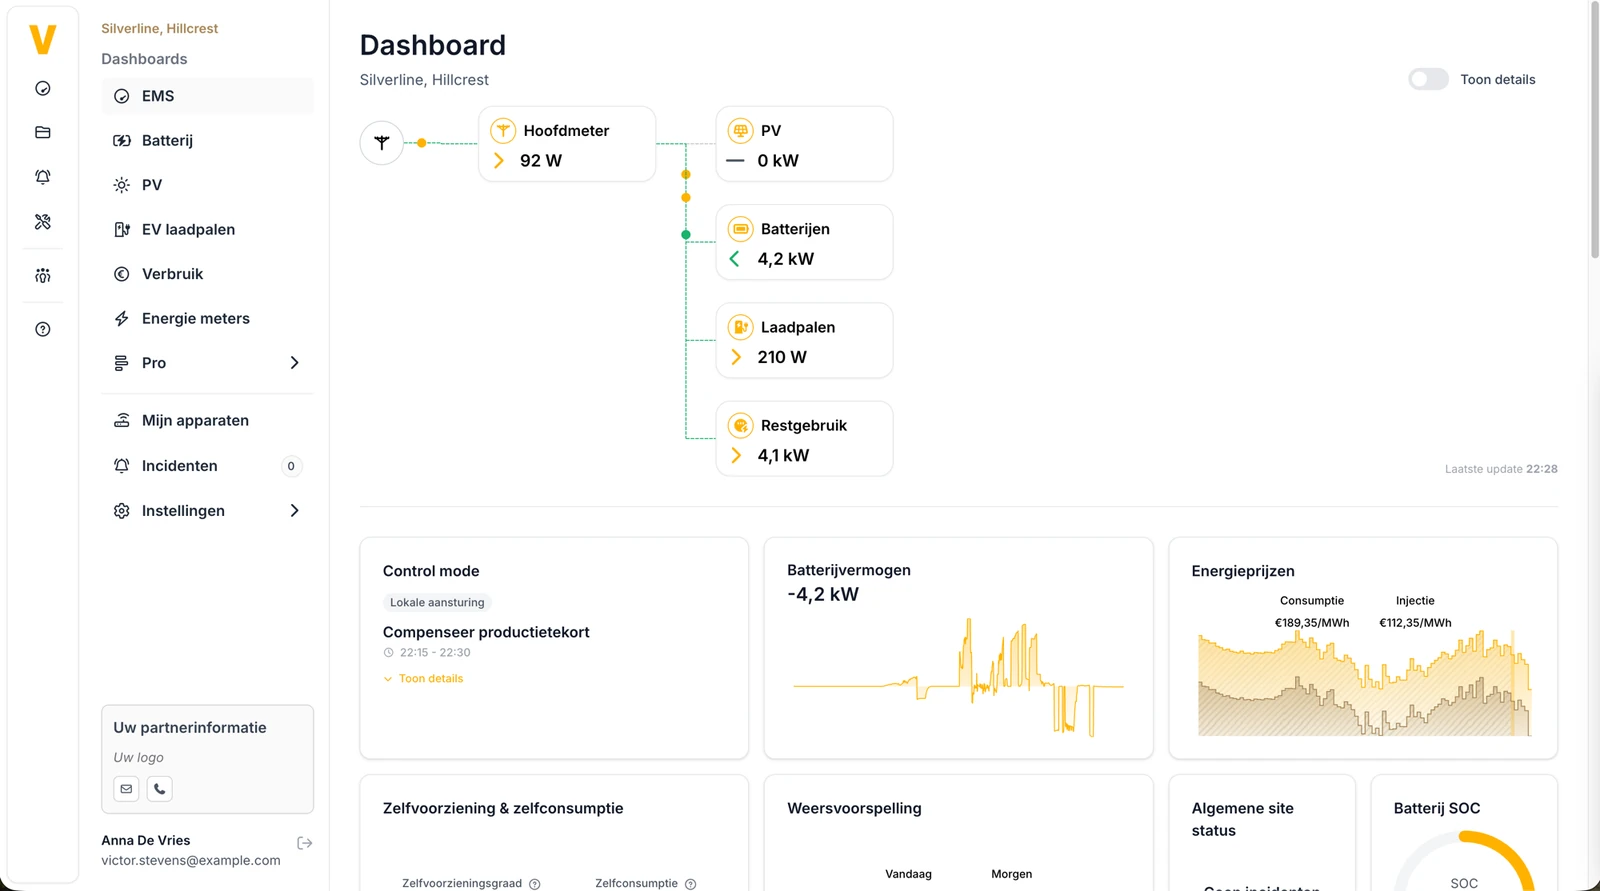
The web platform brings every installation together in one environment: commissioning, configuration and follow-up. Six specialised dashboards per project, Pro charts down to the second and full control, for you as the installer and for your end customer.
The dashboards
Six specialised dashboards per project
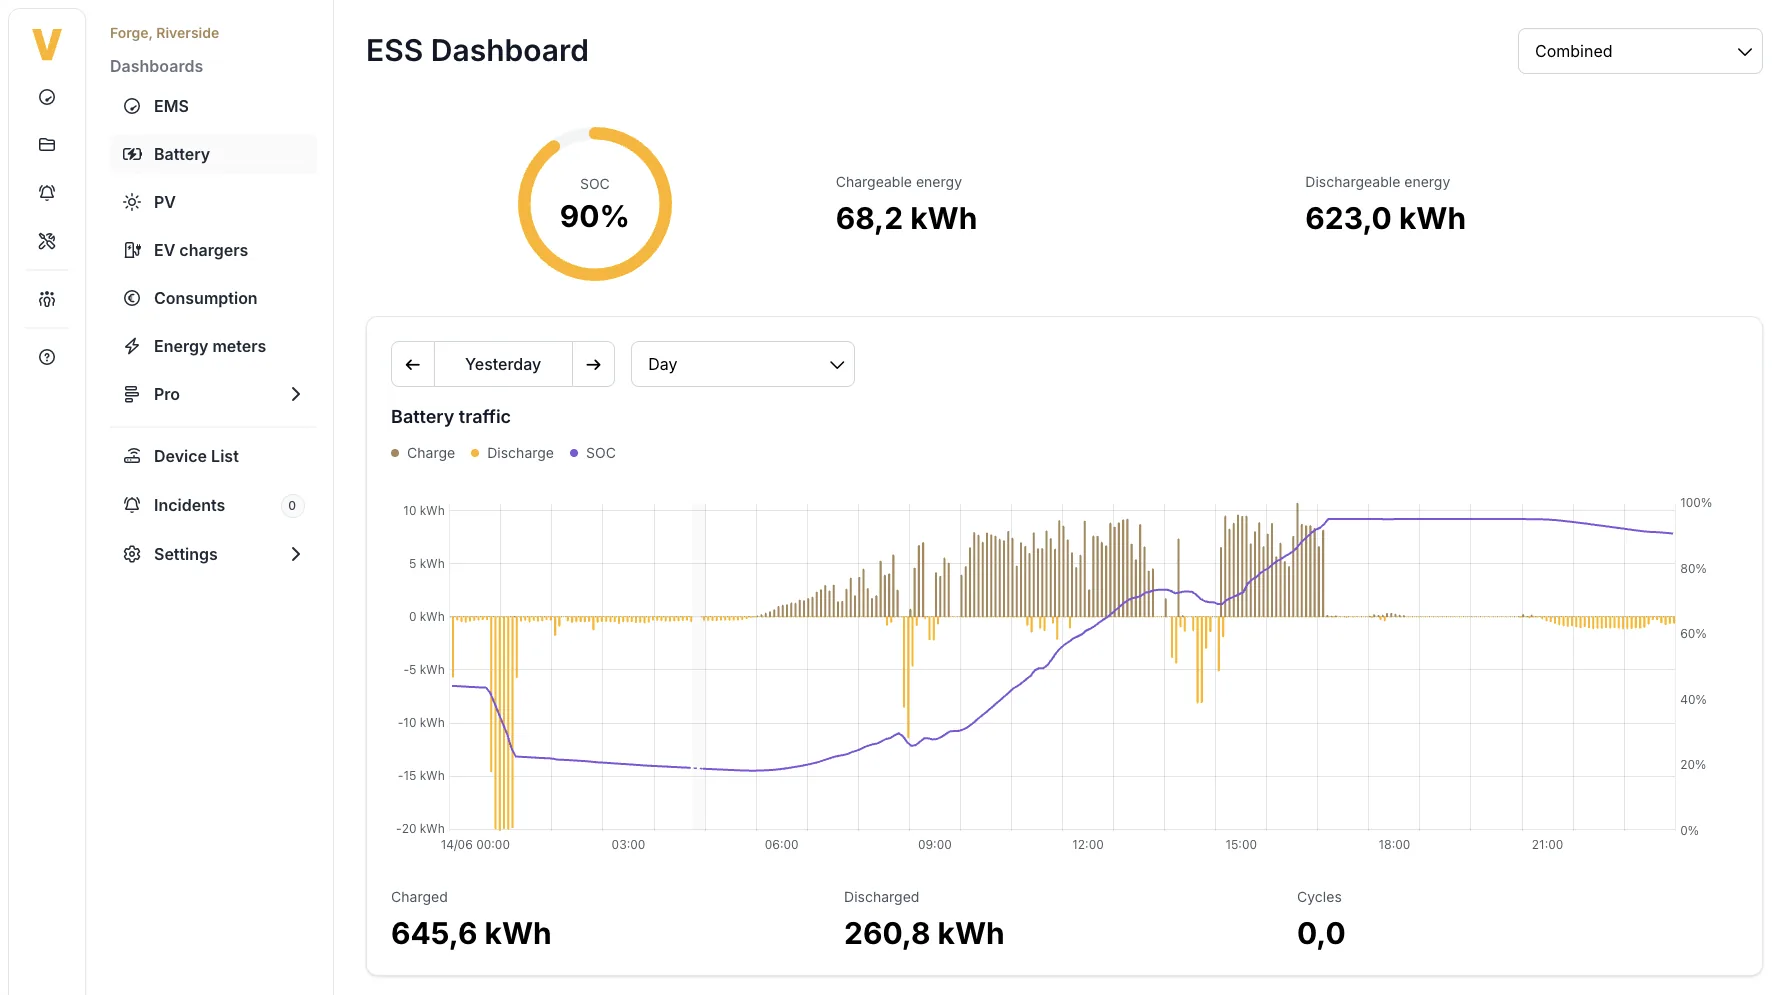
From the real-time energy flow diagram to deep technical analysis. Every project gets a full set of dashboards that you and your customer open in the same environment, each with the right permissions.
- EMS: real-time energy flows, control mode, energy prices, self-sufficiency, weather forecast and the latest control decisions.
- Battery (ESS): SOC, daily cycles, available energy, temperature, voltage and current per module.
- PV: production versus forecast, market prices and curtailment actions.
- EV charging: charging sessions, power distribution and load balancing across the charge points.
- Consumption: usage patterns, self-consumption and trends.
- Energy meters: import/export per meter and net grid exchange.
Pro dashboards
Data down to the second
For engineers and installers, the Pro dashboards go deeper than any standard view: every signal from the installation, sampled per second and freely combined in one chart. Ideal for verifying behaviour and tracing issues fast.
- Algorithm: consumption, battery power, the algorithm's decision, the consumption forecast and the price curve overlaid in one timeline.
- External control: dispatch signals from trading partners on the imbalance market, alongside the project's limits and safety margins.
- Zoom freely: from the last 30 minutes to weeks of history, with the detail you need for troubleshooting.

Insight & prices
See the price and the decision
The platform shows not just what the installation does, but why. Live energy prices, the day-ahead curve and the latest control decision per device sit side by side, so you can trace every action back to the market context.
- Live consumption and injection price per MWh, with the day-ahead curve (EPEX).
- Cheap troughs and peak hours clearly marked on the timeline.
- « Latest control decisions » per battery, inverter and charger.
- Full history for billing, verification and reporting.
Energy prices
Day-ahead · EPEXConsumption
€199.12/MWh
Injection
€84.12/MWh
Latest control decisions
Batteries
-
−5.60 kW
PCS 1
Discharging on peak price
-
0 kW
PCS 2
Standby · spread too small
-
0 kW
PCS 3
Standby · within safety margin
AI in the platform
Vic AI, your assistant in every project
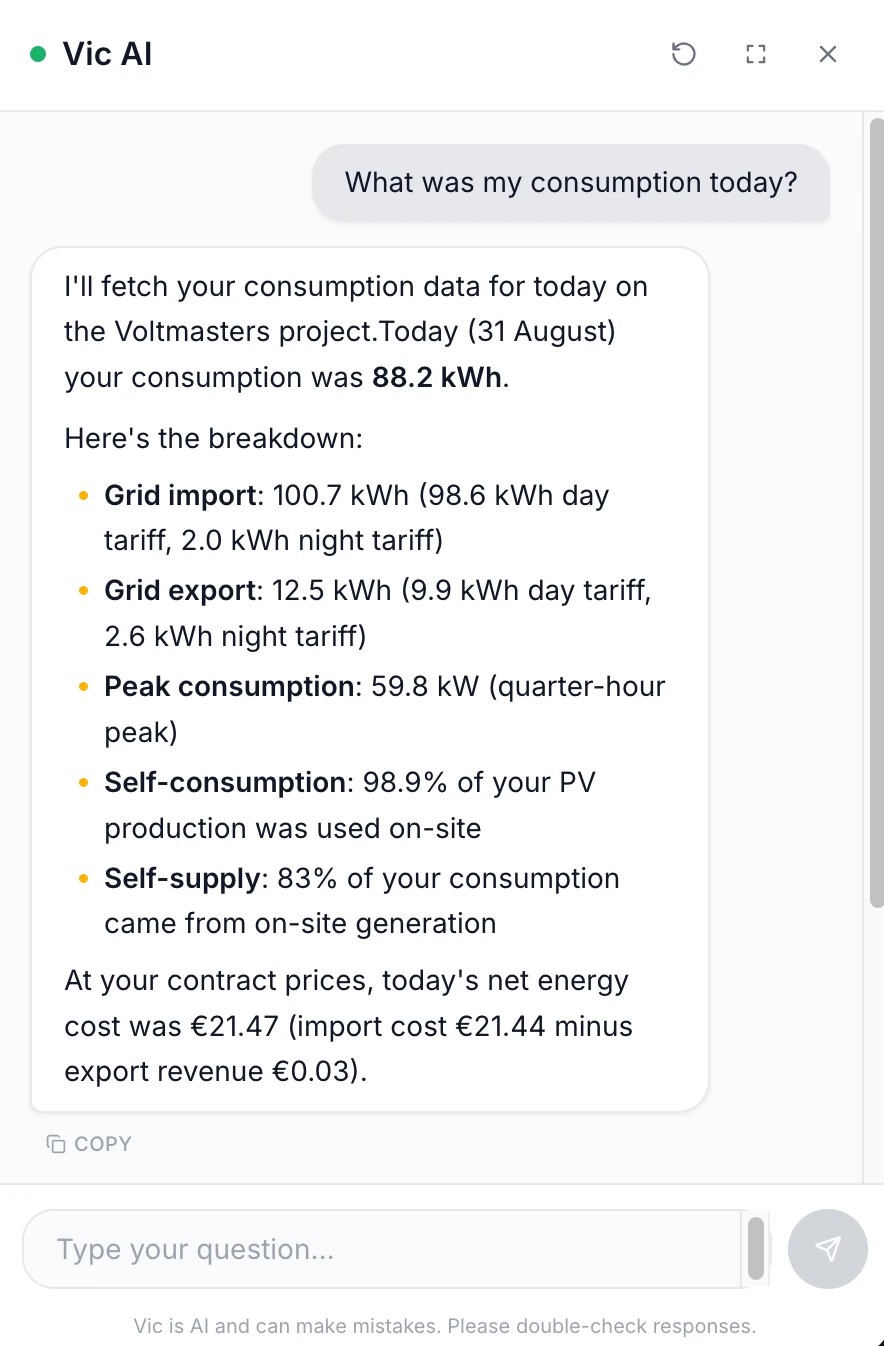
Every project has an AI assistant on board. Vic knows the full Voltmasters documentation and reads the live state of your installation: which devices are in it, which incidents are open and how the controller is configured. Ask in Dutch, French or English and the answer comes back in the same language.
- Answers with sources: the answer plus the documentation pages it is based on, clickable underneath.
- Your own installation: ask about your projects, devices, incidents or the active strategy and Vic reads it live from the platform.
- Straight to the right screen: Vic links you to the page where you make the change, matched to your permissions.
- One click to support: if it does not get solved, you open a support ticket yourself with the whole conversation as context.
Vic reads along, it never changes a setting by itself. Every change stays a deliberate action by you, with your name and the time in the change log.

Configuration
Everything configurable, nothing complicated
A wizard guides you through commissioning; after that you manage every project from one screen. Whatever you set, you test with one click, remotely too.
- Project settings: grid import and export limits, safety margins, main meter and phase type.
- Control strategy: pick the strategy and toggle components on or off individually.
- Load management: priorities per device with configurable hysteresis.
- A tab for every domain: consumption planning, EMS controller, telecontrol, partner and API keys.
- Roles: you configure as the installer, your customer watches along with read access.
Multi-site & roles
All your projects in one portal
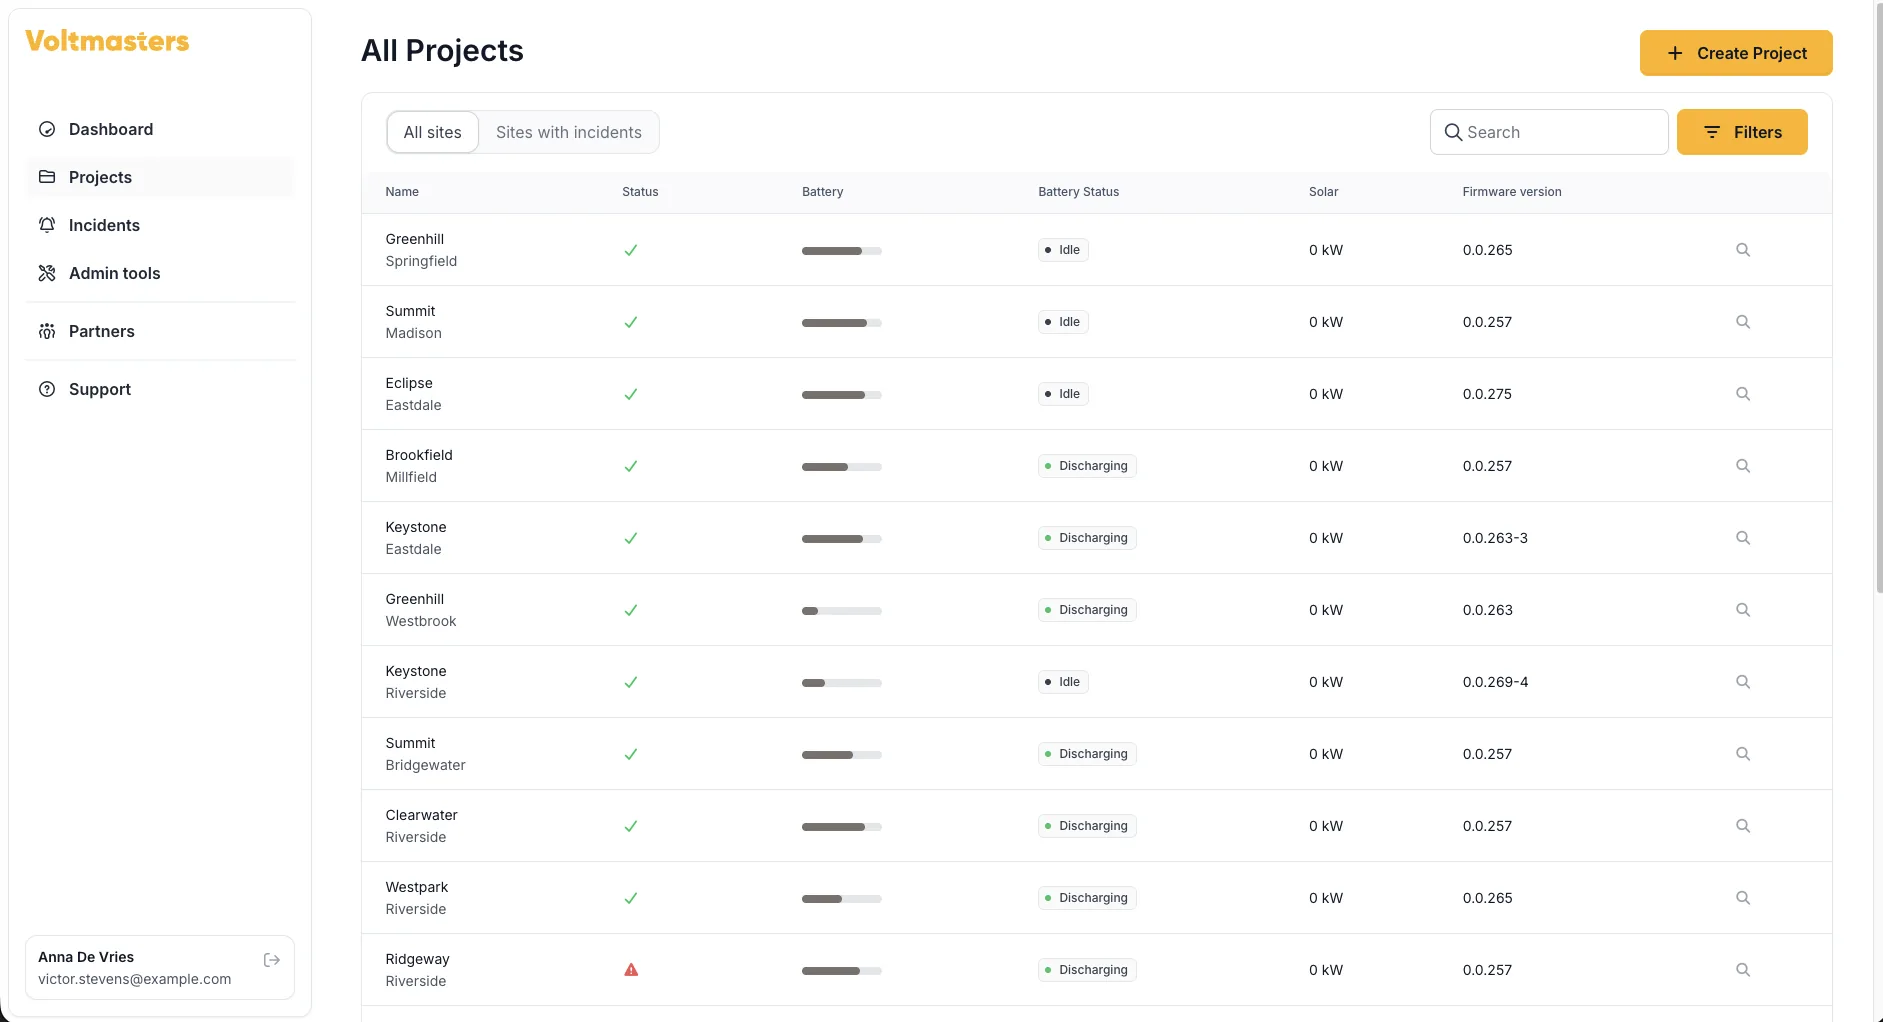
One login gives you the overview across all your installations, with status, battery level and production per site. Role-based access decides who sees what: you manage as the installer, your customer watches along with read access.
- Status overview (healthy, warning, error) across all your sites.
- Switch quickly between projects, without logging in again.
- Read access for your end customer, management rights for your team.
API access for your own reporting
Project-scoped API keys provide read and write access to the energy data. Build your own reporting tools, connect home automation or feed your own customer portal.
Sign-in required
Looking for the technical details and step-by-step configuration? You will find them in our documentation.
Read the documentationReady to make your first project pay off?
Tell us about your next installation. We will show you the platform, help you build the business case and guide you from first quote to certification.
Want to run the numbers first? Try the PV & battery simulator ↗