Voltmasters Platform
Consumption dashboard
The Consumption dashboard in the Voltmasters EMS: measured against predicted usage, and the share of solar energy consumed on site.
The Consumption dashboard shows the total energy consumption of the site and how much of the own solar energy is consumed on site.
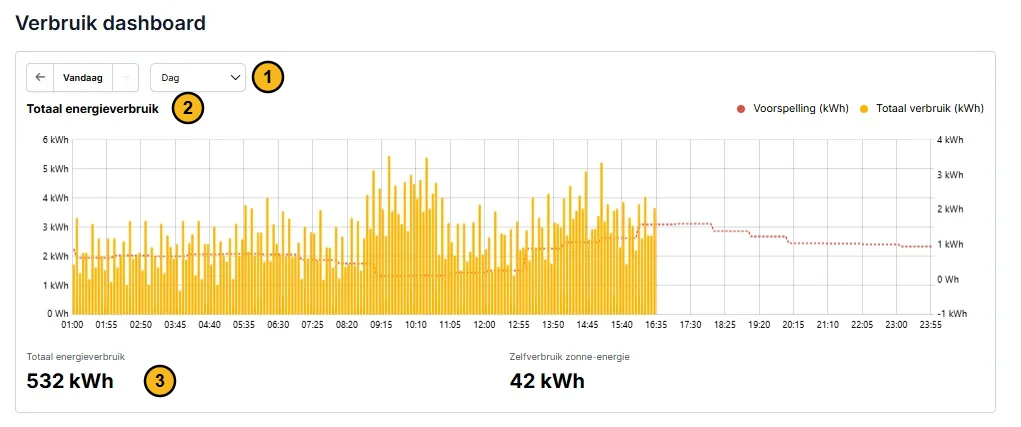
- Date and period of the chart.
- Total energy consumption: the measured consumption as bars and the forecast as a dotted line, also for the rest of the day.
- Key figures over the chosen period: the total energy consumption and the self-consumption of solar energy, in kWh.