Voltmasters Platform
DSO RTU dashboard
The DSO RTU dashboard shows, in real time, how the grid operator is currently constraining your installation through its Remote Terminal Unit, and lists every command the RTU has sent.
The DSO RTU page (Monitoring → DSO RTU) shows the latest constraint snapshot the grid operator's Remote Terminal Unit (RTU) is applying to your installation, and below it the history of every signal the RTU sent.
This page is only available for projects that have a DSO RTU connection configured. If you don't see it in the project menu, no DSO RTU is configured for that project.
The live snapshot
- Restriction banner: tells you whether the RTU is currently constraining the site. It is red while an emergency stop is active, orange when a setpoint is below 100 % or a reason code other than normal applies, and green when there is no active restriction. It also shows when the snapshot was last updated.
- Status & mode: the reactive-power (Q) control mode (local curve, or one of the remote modes) and whether an emergency stop is active for production (injection) and for consumption (offtake).
- Active setpoints: the limits currently imposed by the RTU, as a percentage of their base. 100 % means no limitation.
- Max installation production and Max installation consumption: the caps on the registered assets, relative to the reference powers the operator registered.
- Max grid injection (NKP) and Max grid offtake (NKP): the caps at the grid connection point, relative to the contractual access powers.
- PV production setpoint and Battery production setpoint: per-type caps, only for operators that steer production types separately. A dash means the RTU sends none.
- Min reactive power (Q) and Max reactive power (Q): the reactive-power band, relevant in the remote Q modes.
- Reason active power (P) and Reason reactive power (Q): why the operator steers: Normal, Congestion or Test.
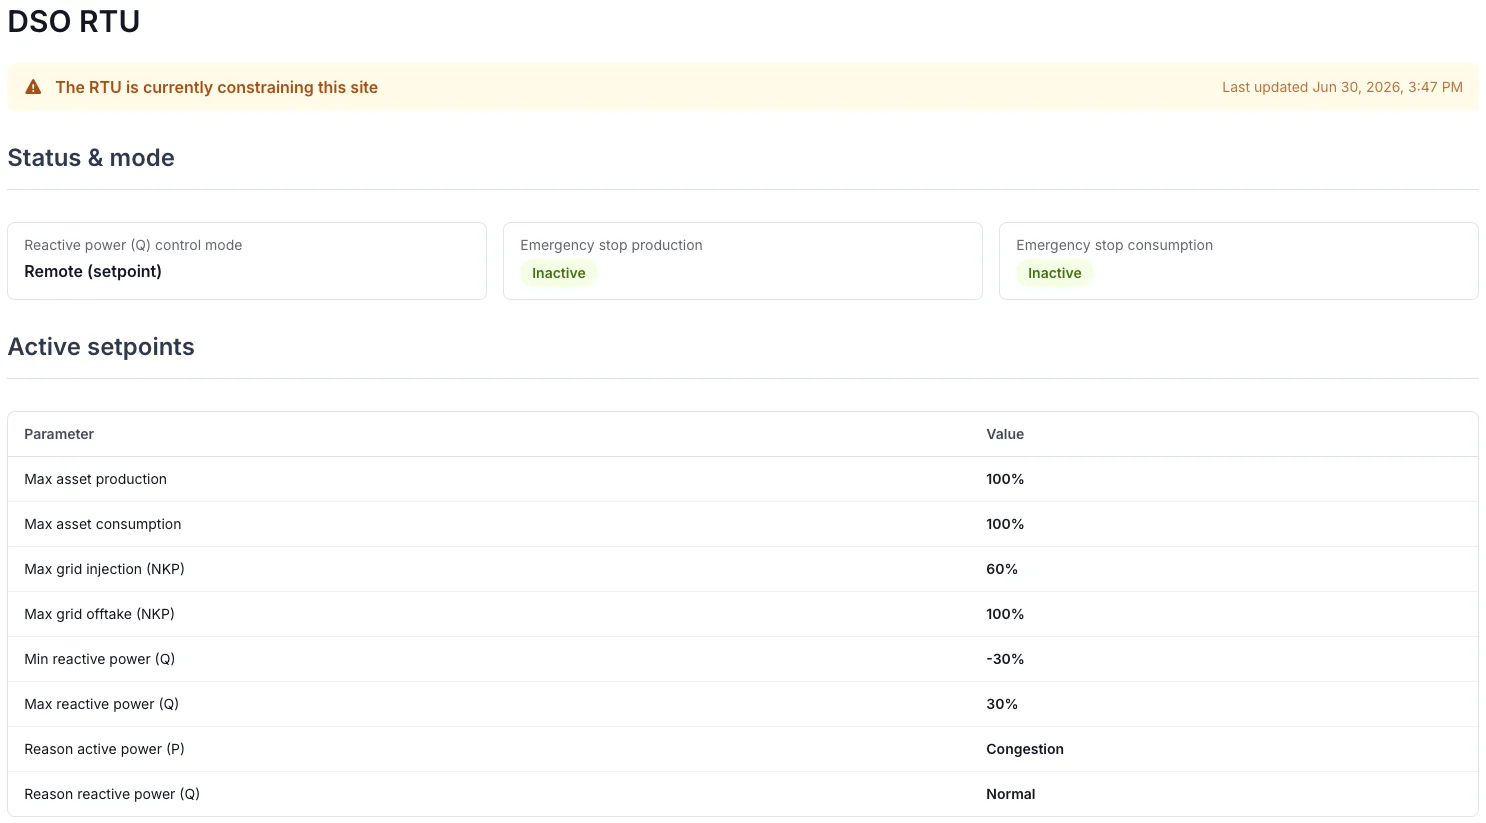
The live snapshot: a site under a 60 % injection cap and a reactive band, sent for congestion.
The snapshot reflects the most recent data the controller reported. When the controller has not reported recent RTU data, the page says that no recent data has been received.
RTU history
The RTU history table lists what the RTU sent, newest first:
| Column | Meaning |
|---|---|
| Time | When the controller recorded the state. |
| Type | Change when a setpoint, stop or mode changed; Heartbeat for the periodic row written while nothing changed. |
| Status | Restricted when any setpoint was below 100 % or a stop was active, otherwise No restriction. |
| Emergency stop | None, Production, Consumption, or both. |
| Max production, Max consumption | The asset caps in force. |
| PV setpoint, Battery setpoint | The per-type caps, for operators that use them. |
| Q mode | The reactive control mode in force. |
Use the Filters to show Changes only (every command, without the heartbeats) or Restrictions only. The date range defaults to the last seven days and can cover at most 31 days.
During a certification the history is the log of the inspector's commands, and the snapshot shows what is in force right now. Commissioning and certification explains what to check per test step.
Frequently asked questions
Why don't I see the DSO RTU dashboard for my project?
The dashboard only appears when a DSO RTU connection is configured for the project. If no connection is configured, the menu item is hidden. See DSO RTU and RTU connection for how the connection is set up.
What is the difference between installation limits and grid (NKP) limits?
Installation limits cap the registered assets as a percentage of their registered reference power, while grid (NKP) limits cap injection or offtake at the grid connection point as a percentage of the contractual access power. The EMS applies both; whichever binds first limits the installation.
What does an emergency stop on the dashboard mean?
An active emergency stop means the grid operator has instructed the installation to stop injecting (production) and, or, consuming (offtake) immediately. The EMS executes this on the connected assets and drives the configured relay outputs. See Emergency stop.
Why does the history show rows while nothing changed?
Those are heartbeat rows: the controller records the state at a fixed interval so that a long period without commands is still visibly covered. Filter on Changes only to hide them.