Microgrid
Microgrid report
The microgrid report of a Voltmasters project: grid availability, outages, reconnections, time per operating mode and generator use over a period, with a CSV export.
The Microgrid report summarises a period: how often the grid failed, how the site got through it and what the generator cost. Open it under Reports → Microgrid report. Every user of the project can see it.
The report is available on projects with Microgrid enabled and on projects with a generator. Without Microgrid it only shows the generator figures.
Period and export
- The report opens on the current month. Pick another preset or a date range of at most 366 days.
- Export downloads the report as a CSV file.
Key figures
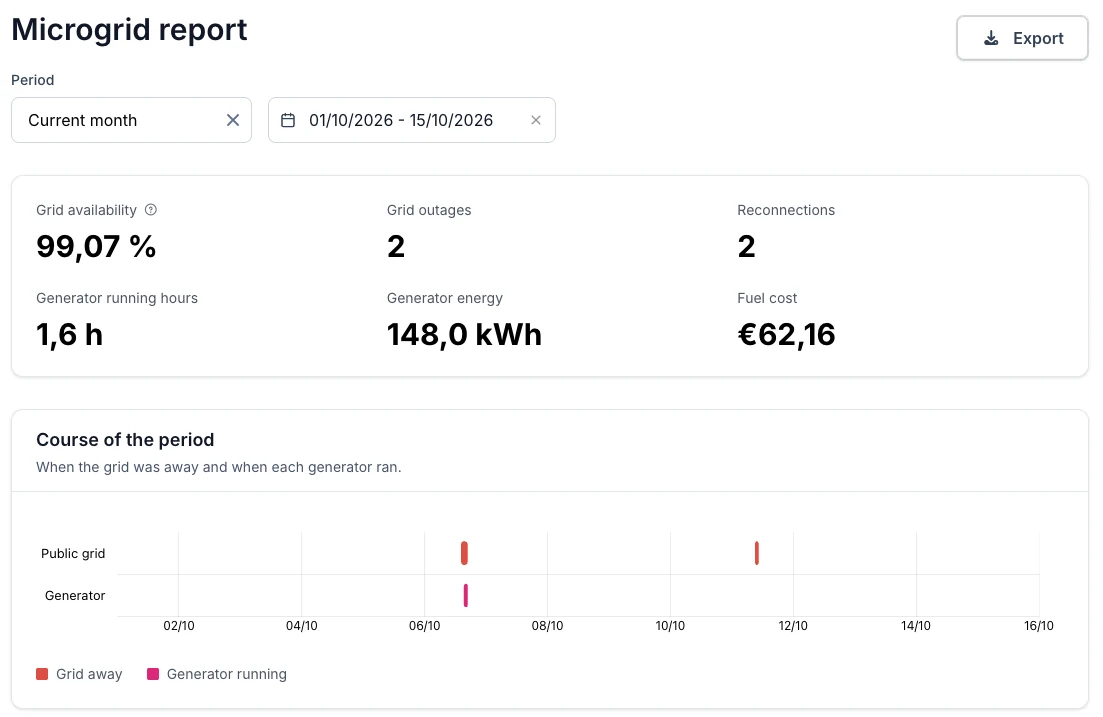
Two outages this month: the first one long enough for the generator to start.
| Figure | How it is calculated |
|---|---|
| Grid availability | The share of time the grid was present, over the part of the period in which the grid state is known. The tooltip shows how large that known part is. |
| Grid outages | How often the grid went from present to absent. An outage counts in the period in which it started. |
| Reconnections | How often the site landed back on the grid after an island. A failed attempt does not count. |
| Generator running hours | The time the generator was recorded running. The generator's own runtime counter is used when recording was missing. |
| Generator energy | The energy the generator produced. |
| Fuel cost | Generator energy times the Fuel cost set on the generator. A generator without fuel cost is left out, and the report says so. |
Sections
| Section | Shows |
|---|---|
| Course of the period | A timeline of when the grid was away and when each generator ran. |
| Time per operating mode | Hours per day in each operating mode, and the share of the whole period. Time without data shows as Not recorded. |
| Generators | Per generator: running hours, energy and fuel cost. |
| Grid outages | Every outage with its start, end and duration. |
| Reconnections | Per reconnection the Interruption (how long the site was without power) and the Procedure (from the start of the return until the site is back on the grid), with the average and the longest. |
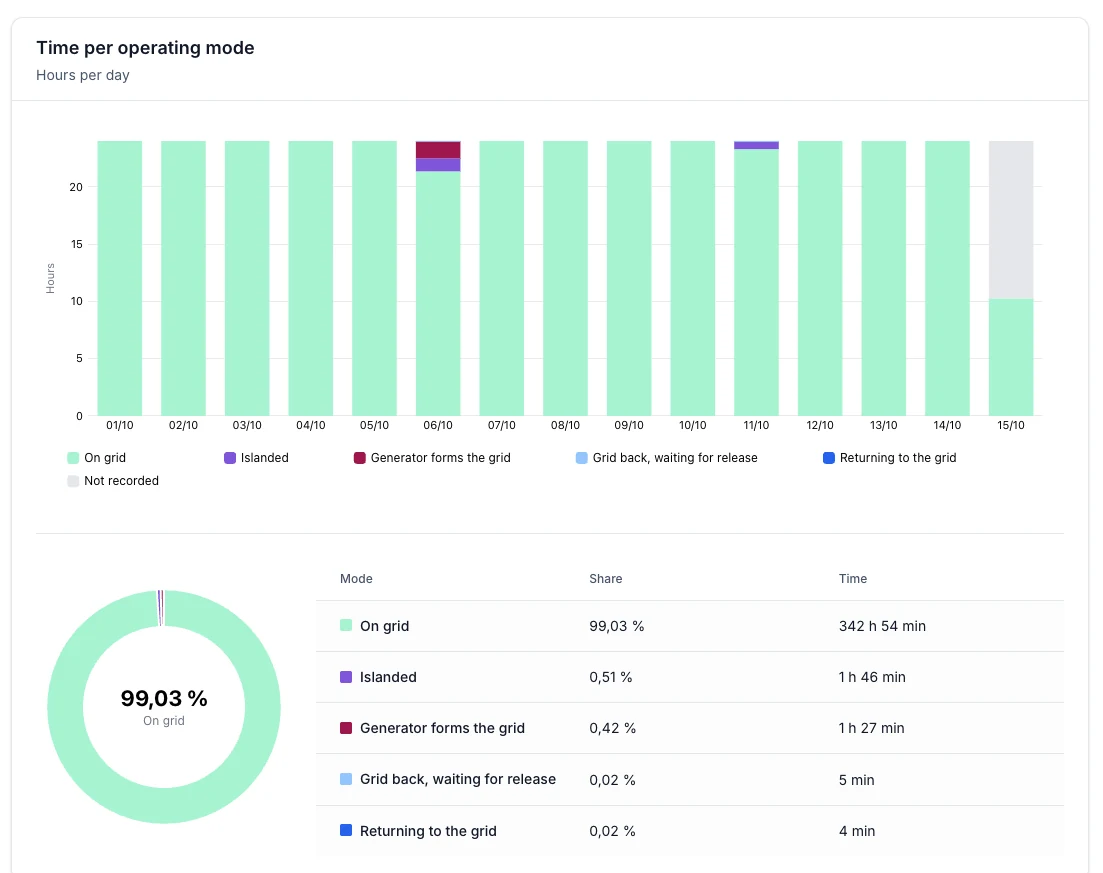
Time per operating mode: on 6 October the site ran as an island on the battery, then on the generator.
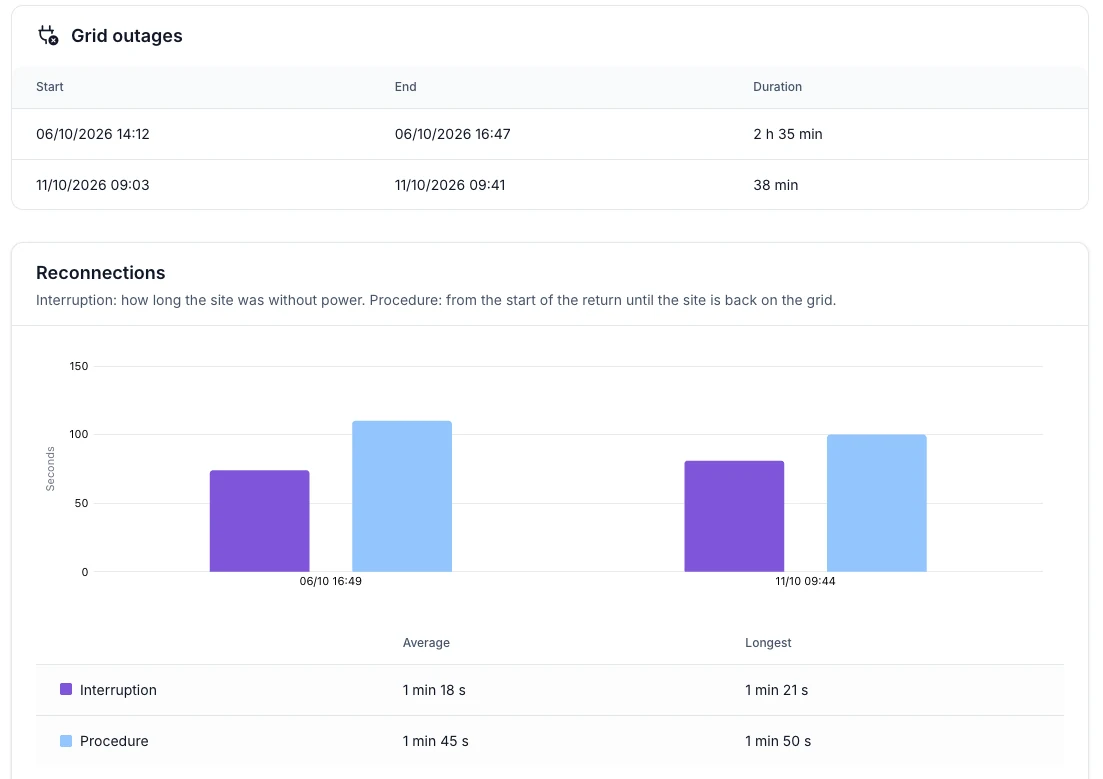
Each outage, and per reconnection how long the site was without power.
Under Advanced → Microgrid the same history is available as an interactive dashboard, with the operating mode and the generator power over time.