DSO RTU
Monitoring
Follow Fluvius Fall-Back Flex in the Voltmasters platform: the status banner and cards, the net consumption chart, the day-ahead planning, the devices held back, the activation history per quarter hour and the dashboard tile.
A project with Fall-Back Flex gets a Fall-Back Flex page under Monitoring, right below DSO RTU. The page refreshes the status, the devices and the planning every 30 seconds.
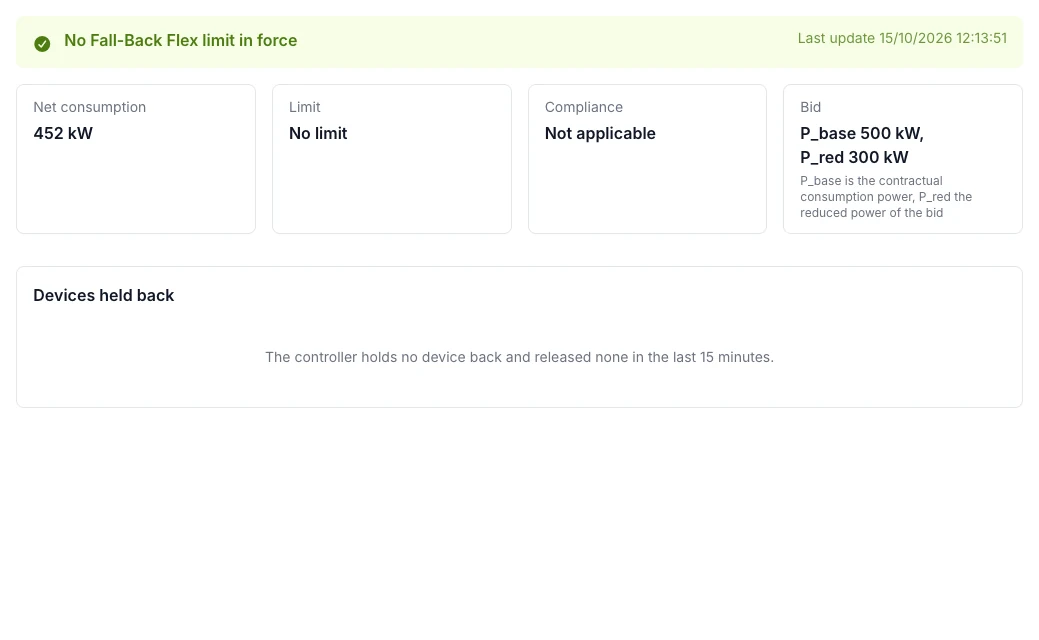
No limit in force
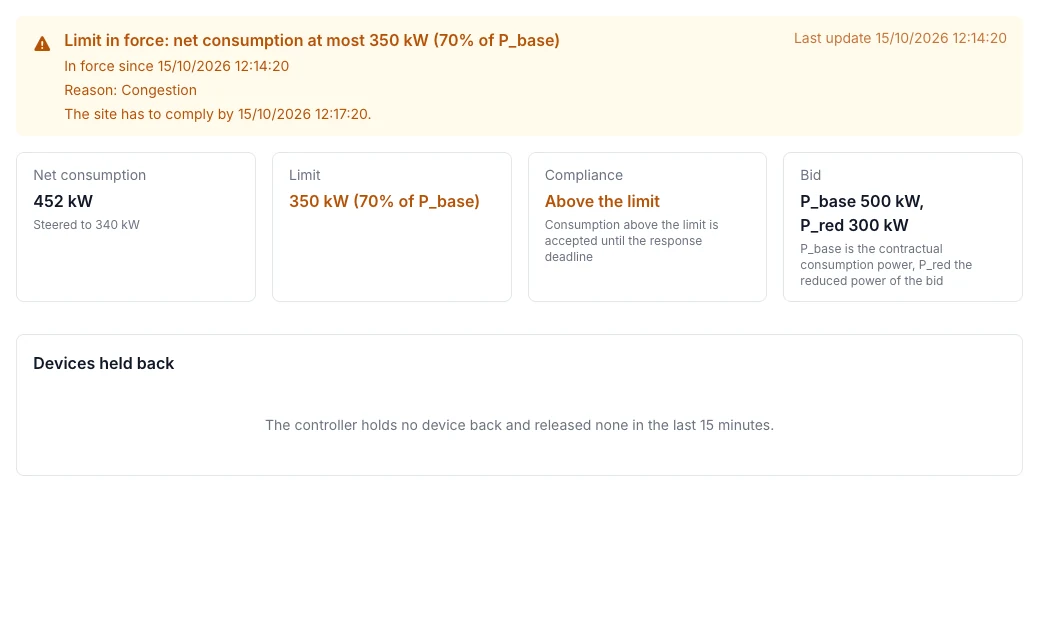
Fluvius sends a limit: 3 minutes to comply
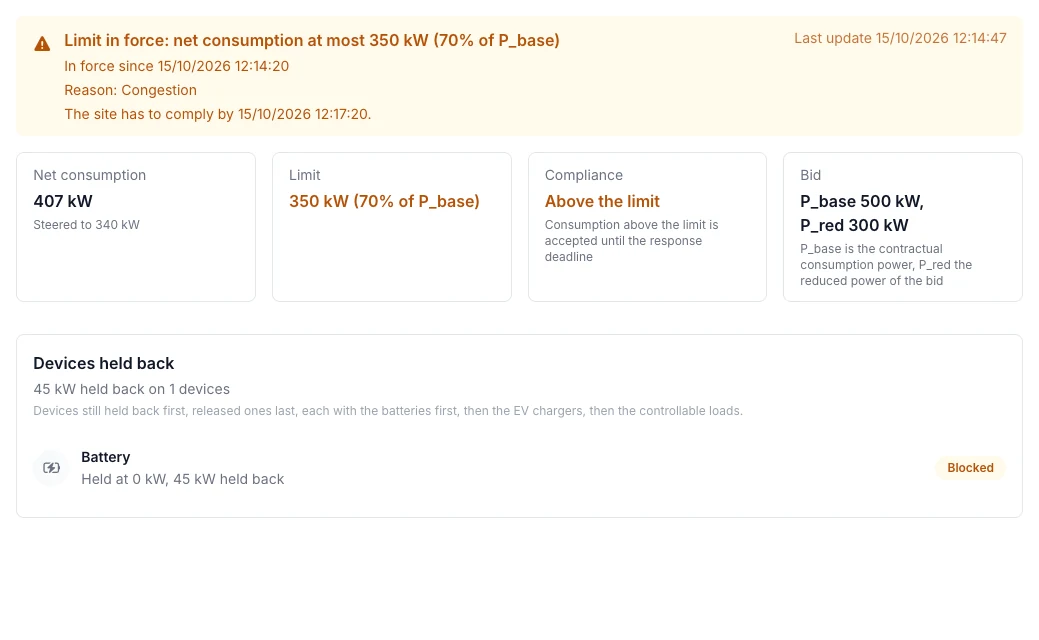
The battery stops charging
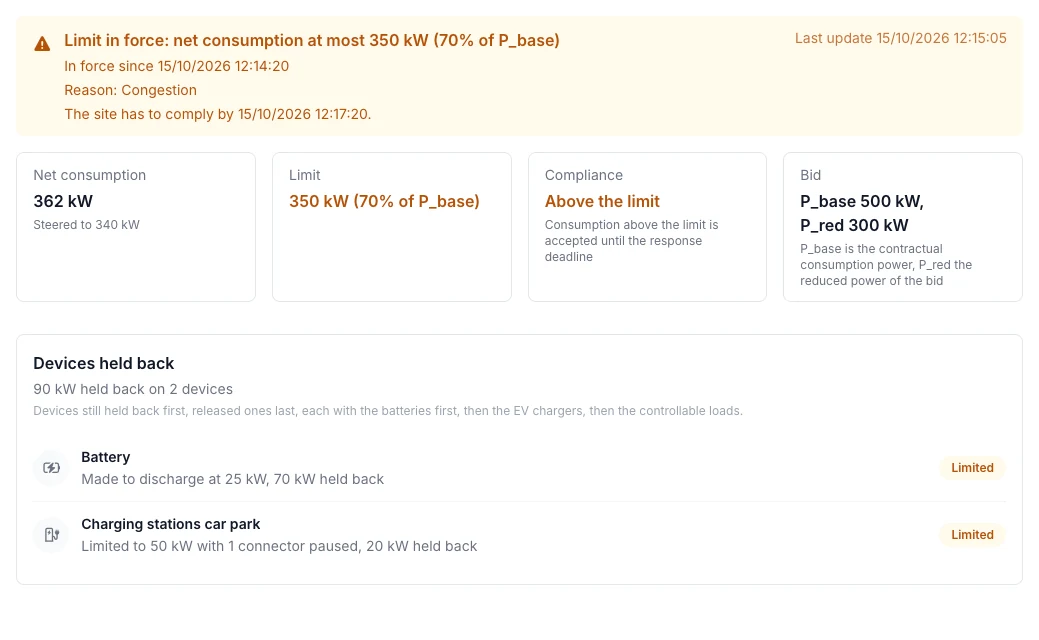
The battery discharges, the EV chargers are limited
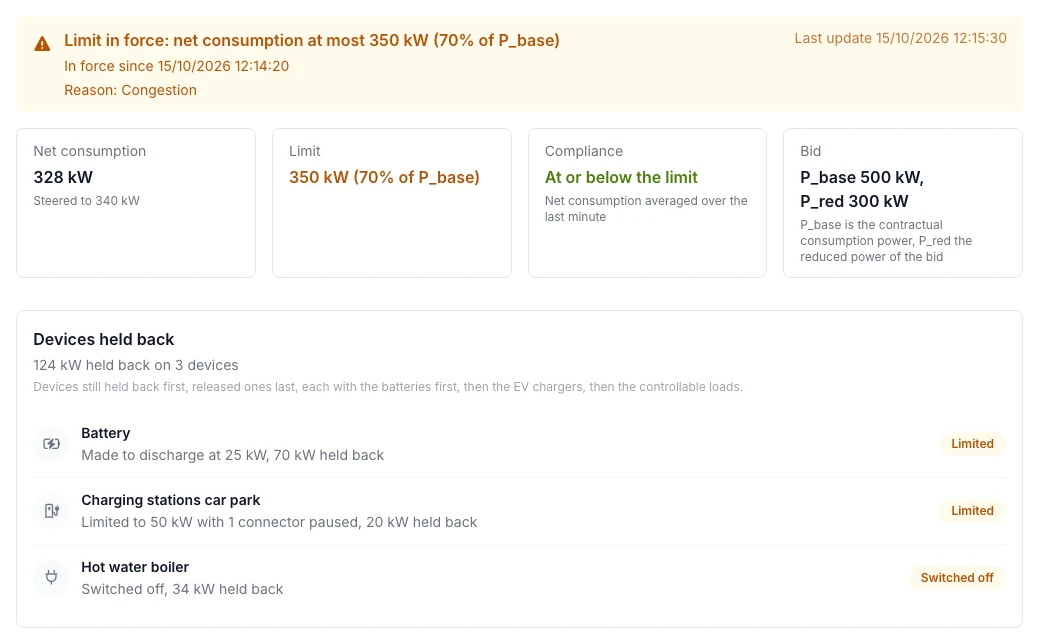
The boiler is switched off: below the limit
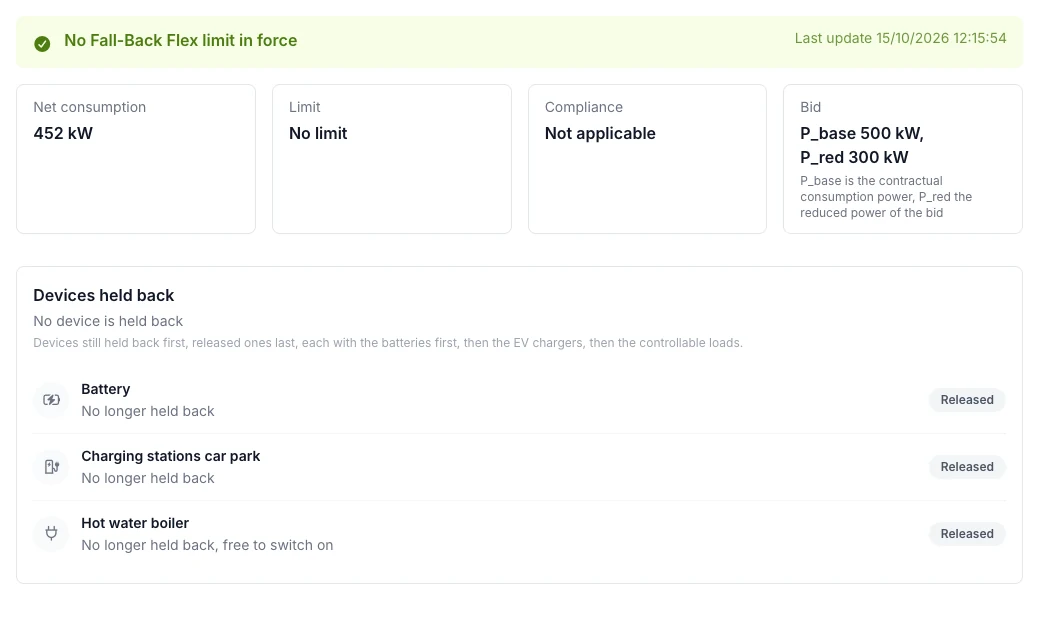
Limit lifted: the devices are released
Status
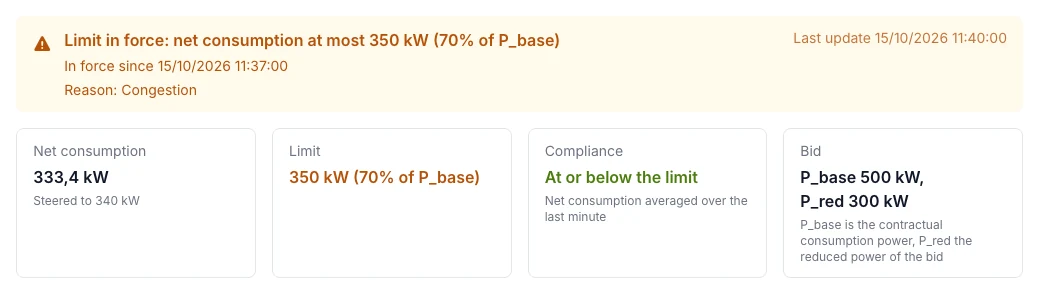
A limit in force and the site below it.
The banner shows the current state:
| Colour | Meaning |
|---|---|
| Green | No limit in force. |
| Orange | A limit is in force, with since when, the reason (congestion or test) and, while the site is still above it, the time by which it has to comply. |
| Red | Emergency stop consumption, or still above the limit after the response time. |
| Grey | No recent status from the controller (nothing for 15 minutes, or more than 2 minutes during a limit), or the status could not be read. |
Below the banner, warnings appear when the grid measurement is unusable, the response time was exceeded, all flexibility is used or the limit is below P_red. The four cards:
| Card | Shows |
|---|---|
| Net consumption | The net consumption at the connection point and the target the controller steers to. |
| Limit | The limit in kW and as a percentage of P_base, or No limit. |
| Compliance | At or below the limit or Above the limit, averaged over the last minute. During the response time above the limit is accepted. |
| Bid | P_base and P_red. |
Net consumption and limit
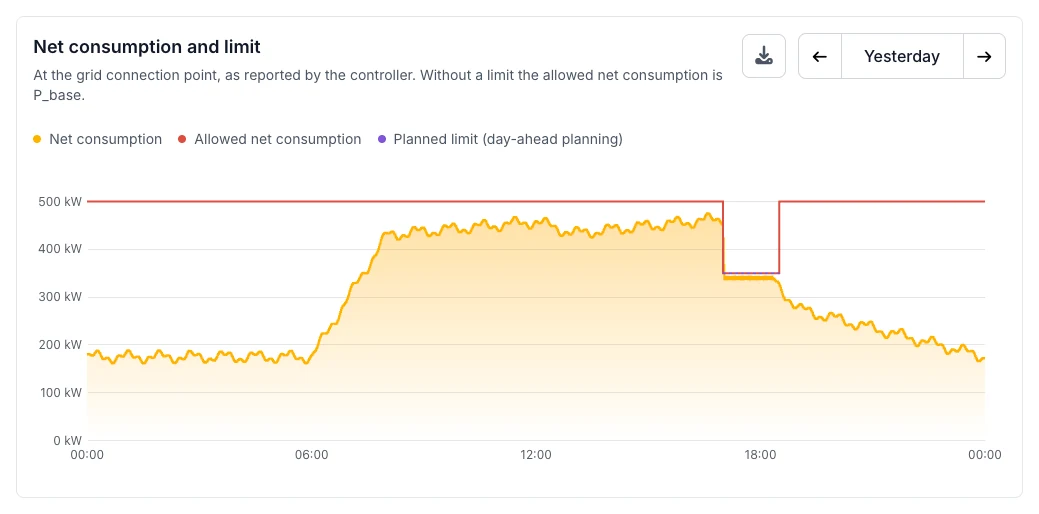
A day with an activation from 17:00 to 18:30.
- Net consumption (yellow) and Allowed net consumption (red). Without a limit the allowed net consumption is P_base.
- Planned limit (purple, dotted): only with day-ahead planning.
- Use the arrows to view another day. The download button exports the chart.
Day-ahead planning
Only with day-ahead planning: the limits Fluvius announced for the rest of today and for tomorrow. See Day-ahead planning.
Devices held back
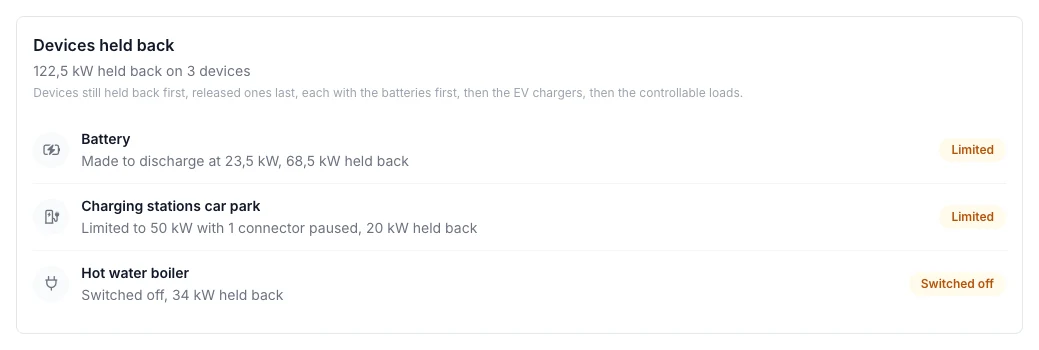
Every device the controller holds back, with how much.
The list shows the devices that are held back now, and the ones released in the last 15 minutes. Held back devices come first, in the order the controller uses them.
| State | Meaning |
|---|---|
| Limited | Runs at a lower power. For a battery: Made to discharge when it discharges to cover consumption. |
| Blocked | Held at 0 kW. |
| Switched off | A controllable load that is off. |
| Standby / Kept off | Capped, but the device asks for less anyway. |
| Released | No longer held back. |
A red note The measurement of the device does not follow its cap yet means the device still draws more than it was allowed. Check its integration if the note stays.
Activation history
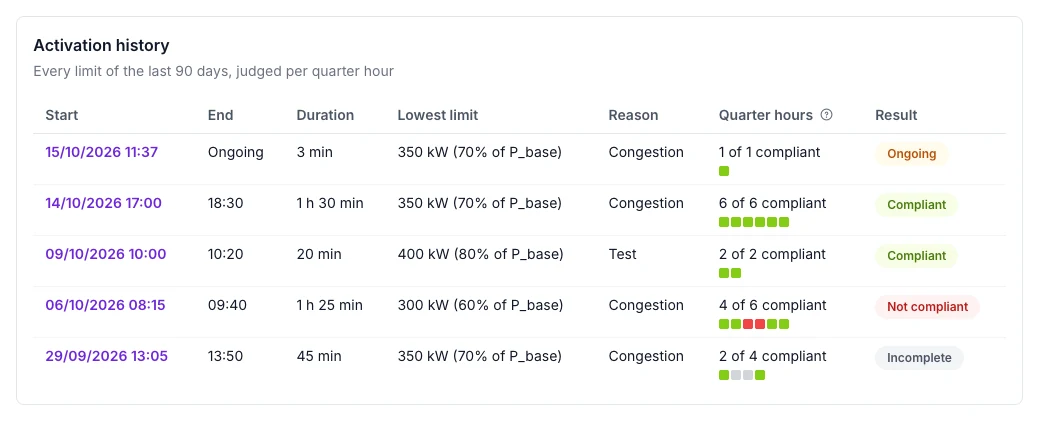
Every limit of the last 90 days, judged per quarter hour.
Click a start time to open that day in the chart. Every quarter hour of an activation gets a coloured block:
| Block | Meaning |
|---|---|
| Green | Compliant: at or below the limit, or still within the response time. |
| Red | Not compliant: above the limit after the response time. |
| Grey | Unknown: the controller reported too little to judge the quarter hour, for example a gap of more than 2 minutes. |
The Result of an activation is Ongoing, Compliant, Not compliant (at least one red quarter hour) or Incomplete (at least one grey quarter hour, or no reported end).
Dashboard tile
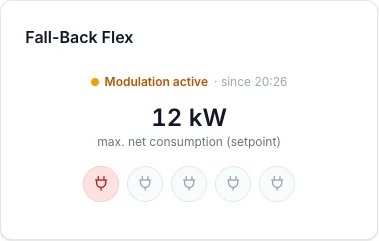
The tile on the project overview during an activation.
The project Overview shows a Fall-Back Flex tile with the same status colour. During a limit it adds the net consumption and the devices held back. View details opens the Fall-Back Flex page.