Voltmasters Platform
PV dashboard
The PV dashboard in the Voltmasters EMS: measured against forecast solar production, and the EPEX day-ahead injection and consumption prices.
The PV dashboard focuses on solar production and market pricing.
What this dashboard shows
- Solar production and prediction: chart compares measured PV output with the forecasted production for the selected period.
- Injection and consumption prices (EPEX day-ahead): chart displays day-ahead market prices for energy injection and consumption. This helps determine when selling to or buying from the grid is profitable.
Use the date-range picker to analyse historical PV performance and price trends.
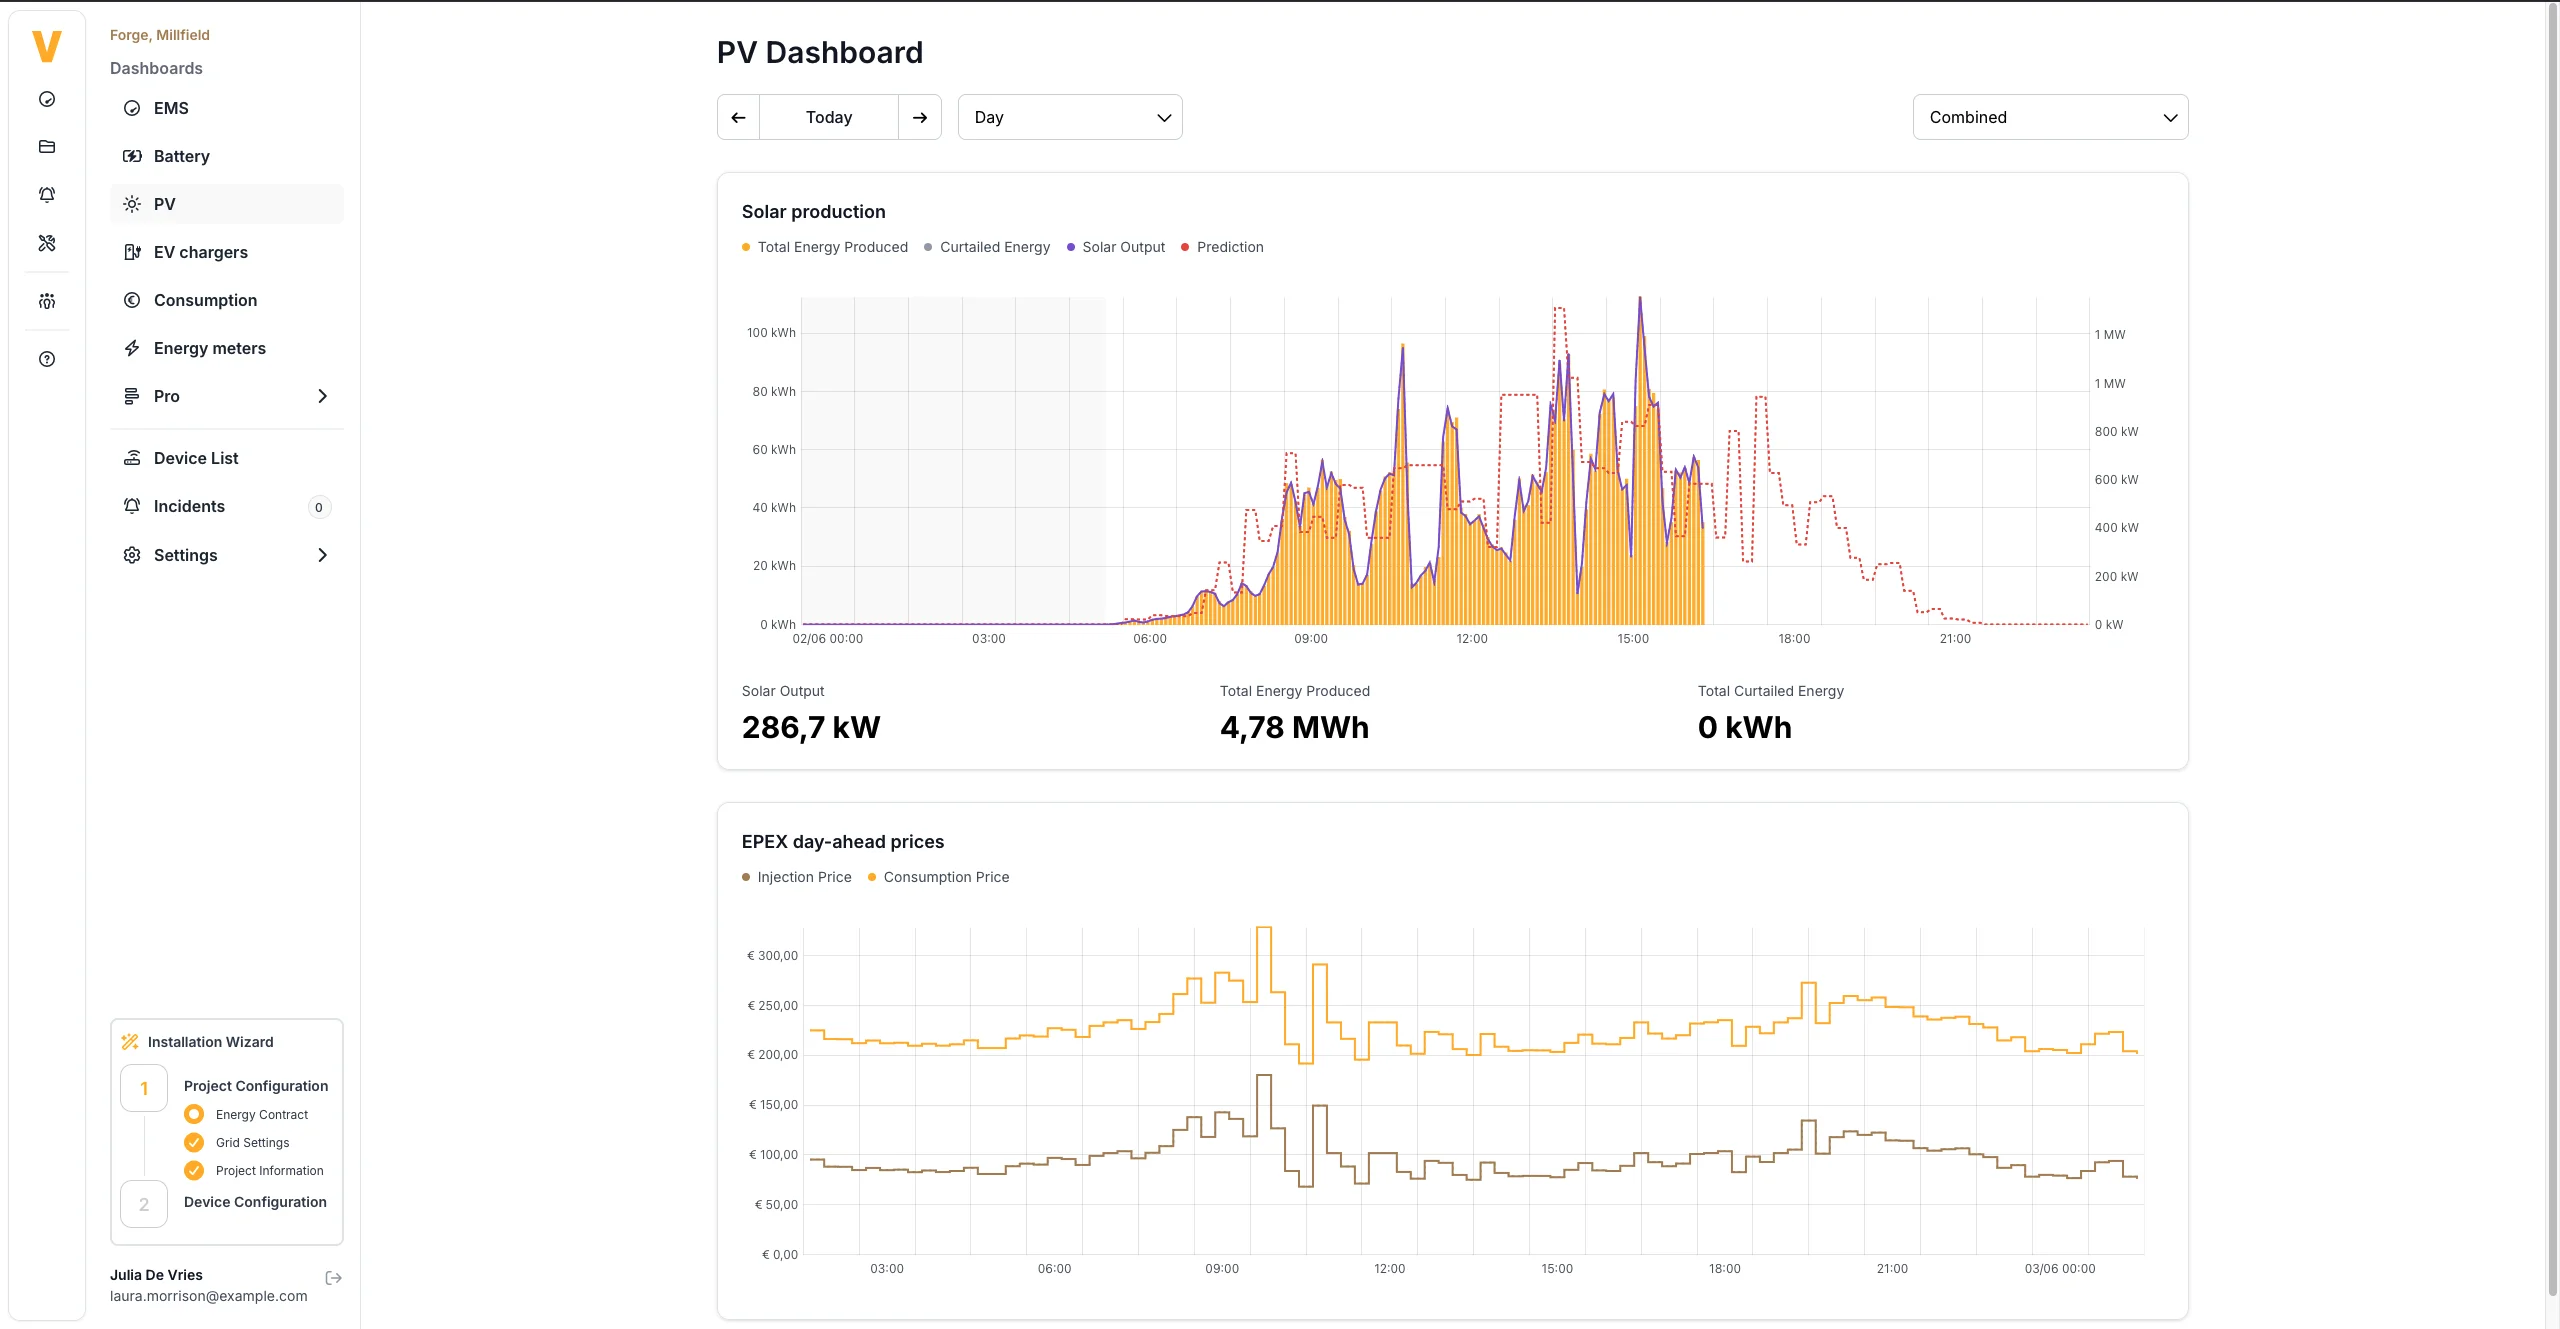
Voltmasters EMS: PV Dashboard
Frequently asked questions
Where can I find how much energy my PV installation has produced?
Open the PV dashboard to see the measured solar production for the selected day, week or month. For a summary of total production over a period, use the consumption report, which includes PV production alongside other key energy indicators.
Where can I see how much of my PV production was curtailed?
Curtailed production is visible directly on the PV dashboard. The Analysis → Advanced → Algorithm screen additionally shows the relationship between energy prices and production decisions in detail.
Where can I find the energy prices?
The PV dashboard shows the EPEX day-ahead injection and consumption prices in a dedicated chart, provided your energy contract supports price-based optimisation. You can select any historical date range to review past prices.
How do I adjust the time period shown in a chart?
Use the date-range picker or period selector (day, week, month, year) above the chart to change the time period. On Pro dashboard screens, you can also zoom into a specific part of the chart by selecting a region directly on the graph.