Microgrid
Live monitoring
Follow a Voltmasters microgrid live on the project dashboard: the status strip, the single line diagram and the procedure panel.
The Microgrid block on the project's Overview shows what the site is doing right now. It appears as soon as Microgrid is enabled on the project and updates live, every time the controller sends new data.
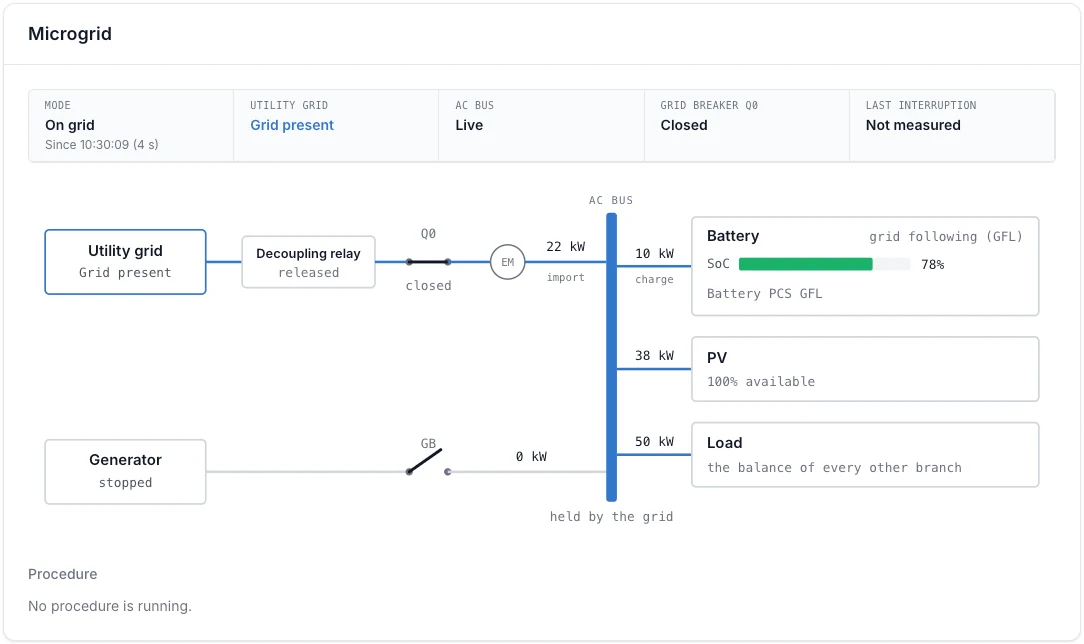
The site on the grid: Q0 is closed, the grid holds the AC bus (blue) and the battery charges with 10 kW.
Status strip
| Field | Shows |
|---|---|
| Mode | The current operating mode and since when. |
| Utility grid | Grid present, grid down or grid unstable. |
| AC bus | Whether the site's bus carries voltage (live or dead). |
| Grid breaker Q0 | Closed or open, as reported by the breaker's feedback contact. |
| Last interruption | How long the site was without power at the last switchover. |
Single line diagram
The diagram follows the path from the public grid to the consumers:
- Utility grid and the Decoupling relay (released or tripped).
- Q0: the grid breaker, and EM: the grid meter with the import or export.
- AC bus: the label below the bus says who holds it: the grid, the battery or the generator.
- Battery: power, state of charge and whether the inverter forms the grid (GFM) or follows it (GFL).
- PV: power and the share that is available.
- Load: the site's consumption, calculated as the balance of the other branches.
- Generator with its breaker GB: running or stopped, and its power.
The colour of the bus and the branches shows who forms the grid: blue for the public grid, green for the battery, pink for the generator. Grey means no voltage or no reliable data. Values the controller cannot read are drawn grey with ? kW.
Procedure panel
Below the diagram, the Procedure panel shows the procedure the controller is running: a mode change, a reconnection to the grid, a converter repair or a manual grid mode. It shows when the procedure started and, while the controller waits for a device, what it waits for, with a bar that runs up to the time-out.
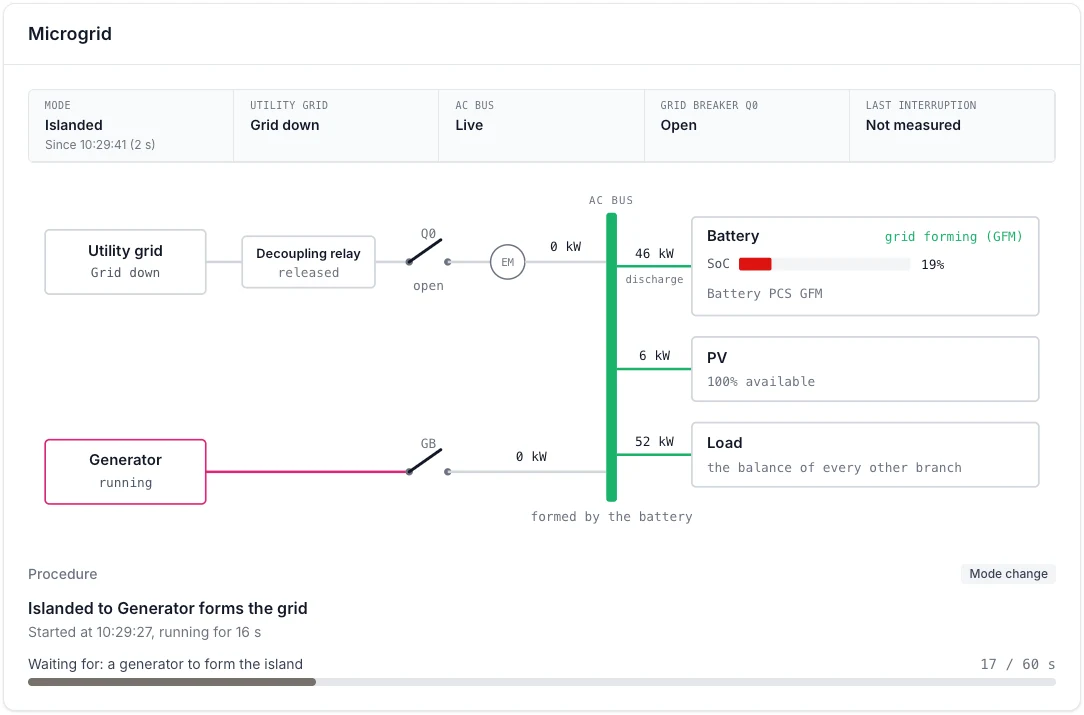
A mode change in progress: the controller waits up to 60 seconds for the generator to form the island.
During a reconnection the panel lists the eight steps of the procedure. See Grid reconnection.
When the data is not live
- Right after opening the page, the block shows the last stored minute until the first live message arrives.
- If no new data arrives for 30 seconds, a banner says No new data since … and the diagram is greyed out. The controller or its connection may be down.
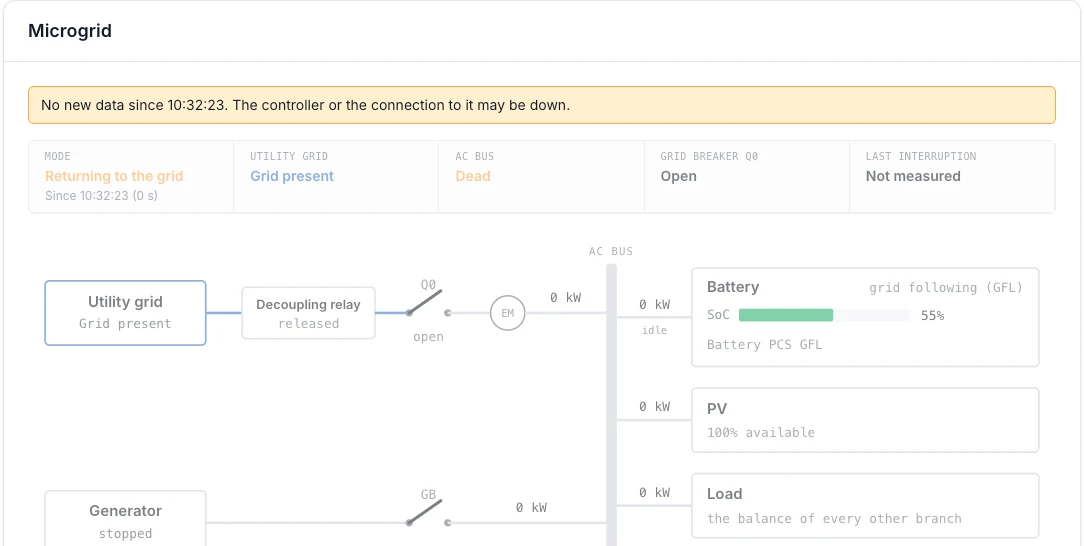
No fresh data: the banner warns and the diagram is greyed out until the controller reports again.
Microgrid tile
Among the tiles of the Overview, the Microgrid tile sums up the situation in one glance: the state (On the grid, Island operation, Generator operation, Grid is back, release needed or Reconnecting to the grid) in a colour that is green only on the grid, with the Grid, the Generator (if the project has one), the SoC and the Autonomy: how long the battery can carry the current consumption.