Elia plans to introduce a new imbalance price formula on 24 November 2026, subject to approval by the CREG. A simulation of that formula for January to July 2026 is already online. We compared it with the real imbalance prices and the day-ahead prices for the same 20,352 quarters. The short version: middays get more expensive, evenings get cheaper, and part of the value of a battery that sells in the evening moves to solar panels.
The four main shifts
- The gap between evening and midday shrinks by 39%. The daily average from 17:00 to 23:00 minus that from 10:00 to 16:00 falls from 84.2 to 51.1 €/MWh.
- Fewer negative quarters. 6.3% of quarters have a negative price, compared with 9.0% under the current formula. Between 11:00 and 16:00 it is 14.7% compared with 23.9%.
- Evenings drop below day-ahead. Between 17:00 and 23:00 the imbalance price is on average 11.0 €/MWh below day-ahead. Today that is 1.2 €/MWh. The median is −15.0 compared with −9.4 €/MWh.
- Extreme quarters remain. The most expensive simulated quarter costs 7,834 €/MWh. Under the current formula the most expensive quarter was 2,131 €/MWh.
What changes in the formula
The imbalance price is the price at which Elia settles the imbalance of the balance responsible parties every quarter. Anyone with a contract that links injection or offtake to the imbalance price has that price passed on. The new formula changes how Elia derives that price from the activated reserves.
Today the price follows the marginal price of the activated balancing energy. When the system is short, the alpha component is added; when it is long, it is subtracted. So the most expensive reserve Elia had to activate sets the price.
short: marginal upward price + α
long:  marginal downward price − α
This rule reproduces all 20,352 published quarter-hour prices from January to July. The comparison below therefore starts from the real settlement.
From 24 November the price becomes a weighted average of the aFRR price and the mFRR price, with weights Elia sets per quarter. The alpha component disappears.
waFRR × aFRR price + wmFRR × mFRR priceOnly in exceptional circumstances is an incentivizing component added: when the FRCE exceeds the Level 2 target and the system imbalance is larger than 250 MW. In the simulation that happened in 53 quarters (0.26%), with a component between −1,000 and +1,000 €/MWh. In 45 of those, the imbalance price was equal to that component.
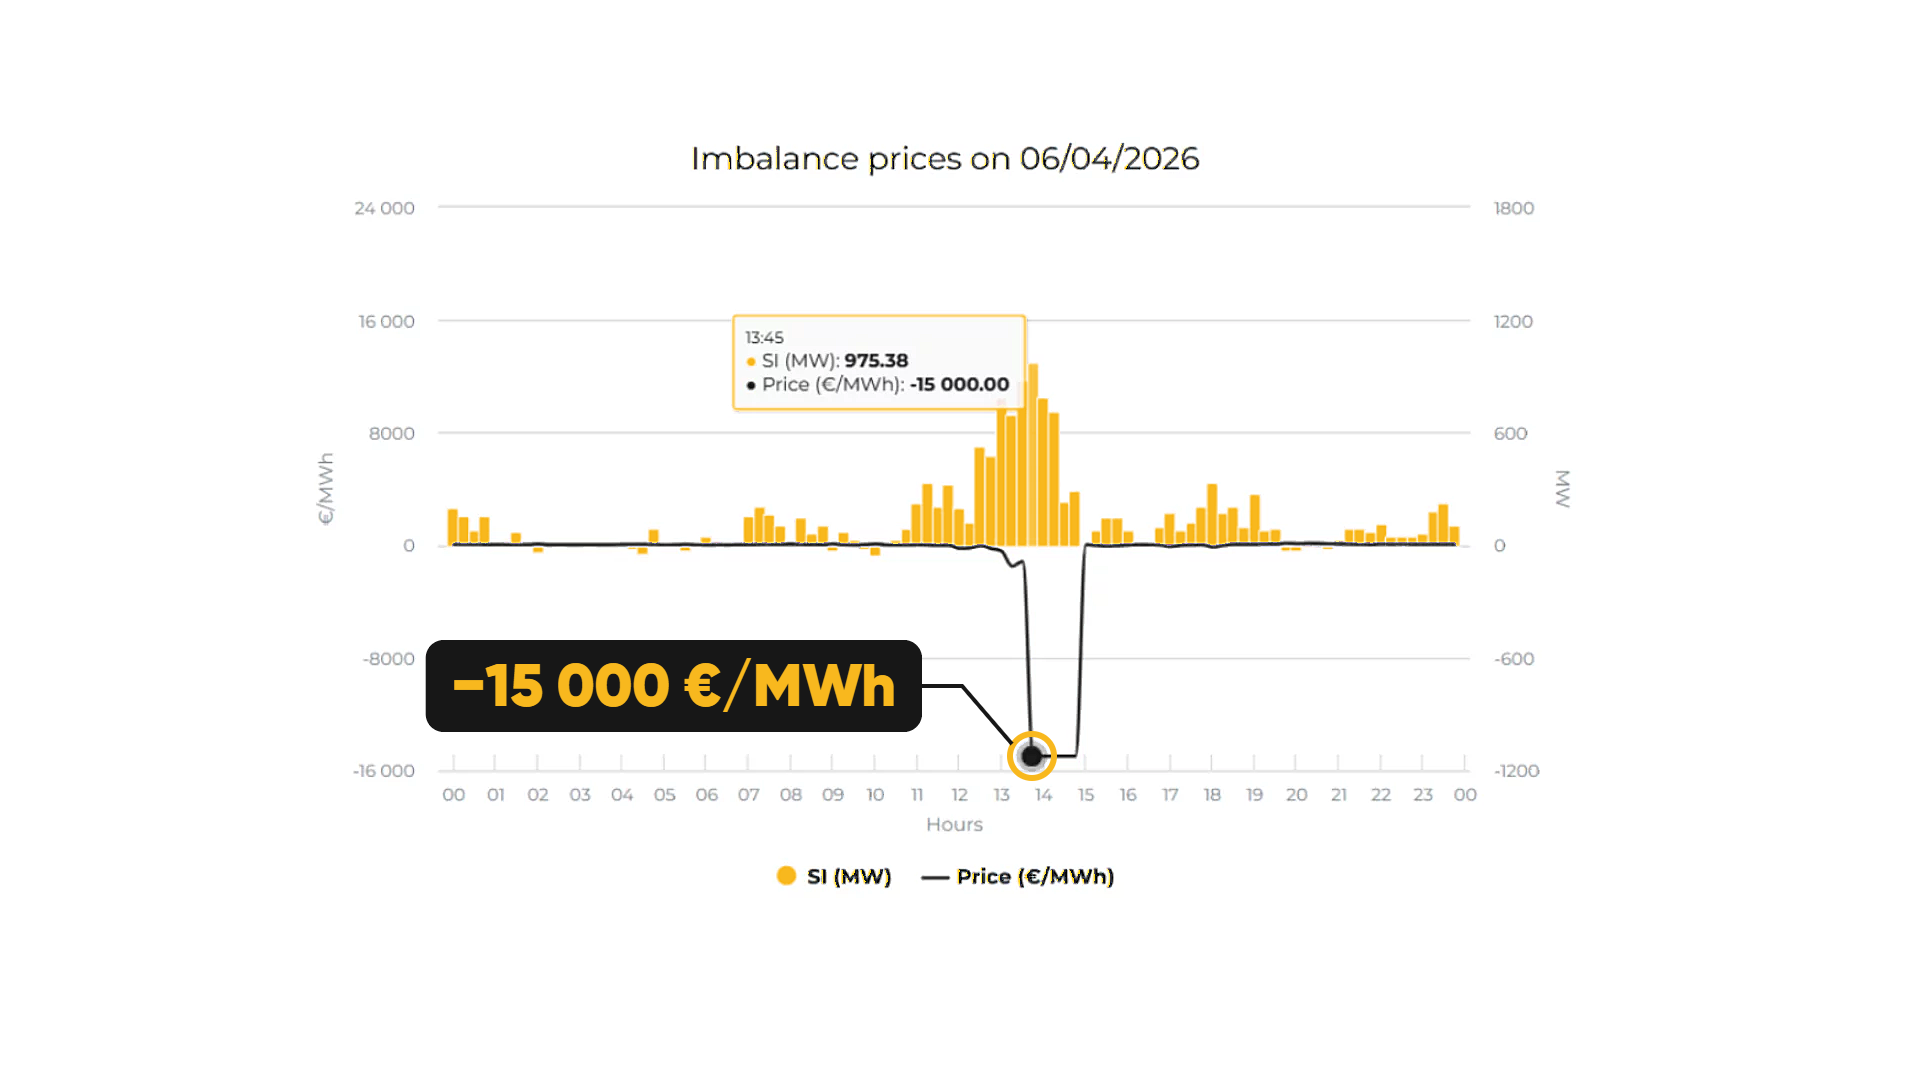
Easter Monday: from −15,000 to −4,509 €/MWh
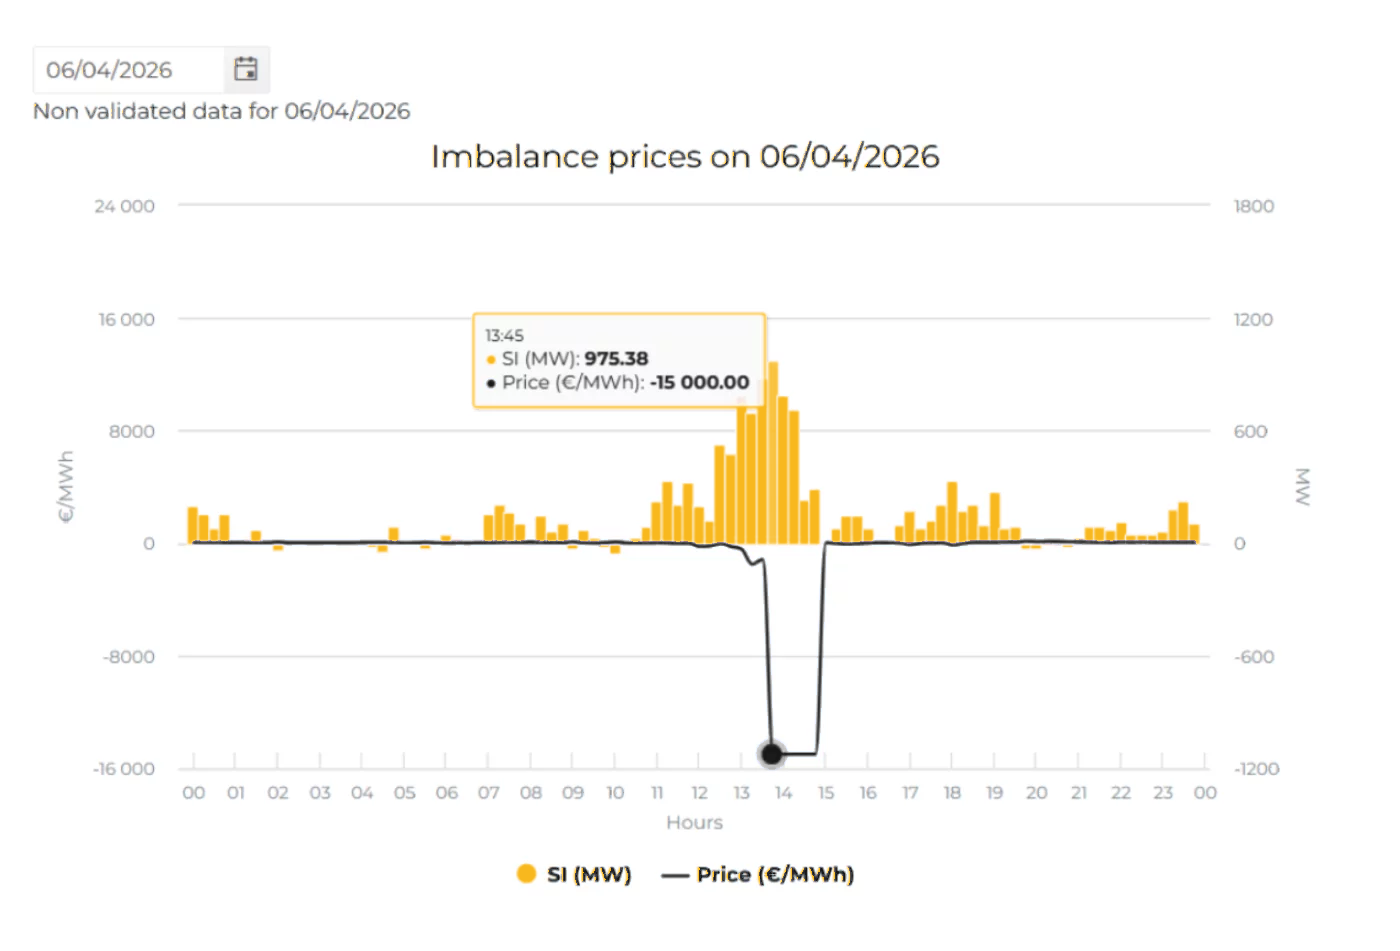
On 6 April the imbalance price sat at −15,000 €/MWh for five quarters, from 13:45 to 15:00. That was the marginal downward price, and the mFRR price was also at −15,000 €/MWh. The new formula weights that mFRR price together with the aFRR price. At 13:45 that gives 0.709 × −209 + 0.291 × −15,000, or about −4,509 €/MWh. Over the five quarters the new price ranges from −2,721 to −6,573 €/MWh. Still a hefty negative price, but far from the floor. Day-ahead was between −86 and −118 €/MWh at the time.
More expensive by day, cheaper in the evening
The difference with day-ahead shifts across the day. Between 10:00 and 18:00 the new imbalance price is a median 1.7 to 13.0 €/MWh above day-ahead. Under the current formula that fluctuates between −5.5 and +5.0 €/MWh. From 19:00 it flips: until 23:00 the new price is a median 17.6 to 22.4 €/MWh below day-ahead, compared with 8.7 to 14.8 €/MWh today. From March to July the evening median is lower every month than under the current formula.
Imbalance price minus day-ahead, median per hour
€/MWh, Belgian time, 1 January to 31 July 2026. The median keeps a few extreme quarters out of the picture.
Table with median and mean per hour
| Hour | Median current | Median new | Mean current | Mean new |
|---|---|---|---|---|
| 00:00 to 01:00 | −4.1 | −10.6 | 2.2 | −8.0 |
| 01:00 to 02:00 | −1.0 | −6.3 | 1.8 | −4.0 |
| 02:00 to 03:00 | 0.8 | −4.1 | 2.3 | −3.9 |
| 03:00 to 04:00 | 1.2 | −3.1 | 1.4 | −4.0 |
| 04:00 to 05:00 | 0.6 | −3.3 | 0.6 | −7.2 |
| 05:00 to 06:00 | 0.6 | −6.3 | −0.4 | −7.7 |
| 06:00 to 07:00 | −3.4 | −9.1 | −0.7 | −5.4 |
| 07:00 to 08:00 | −14.0 | −16.2 | −8.4 | −13.4 |
| 08:00 to 09:00 | −17.0 | −12.2 | −8.6 | −3.9 |
| 09:00 to 10:00 | −13.0 | −6.3 | −4.2 | 3.4 |
| 10:00 to 11:00 | −5.5 | 1.7 | 1.3 | 15.4 |
| 11:00 to 12:00 | −1.0 | 6.5 | 11.5 | 18.8 |
| 12:00 to 13:00 | −1.0 | 10.5 | 8.6 | 21.6 |
| 13:00 to 14:00 | 0.0 | 10.5 | −10.4 | 24.1 |
| 14:00 to 15:00 | 5.0 | 13.0 | −58.9 | 6.2 |
| 15:00 to 16:00 | 4.9 | 8.5 | 13.8 | 19.8 |
| 16:00 to 17:00 | 3.3 | 6.1 | 7.8 | 9.8 |
| 17:00 to 18:00 | 1.6 | 2.8 | 7.8 | 10.6 |
| 18:00 to 19:00 | −3.4 | −4.3 | 3.8 | 0.3 |
| 19:00 to 20:00 | −14.8 | −20.4 | −5.9 | −16.0 |
| 20:00 to 21:00 | −14.3 | −22.4 | −9.8 | −24.7 |
| 21:00 to 22:00 | −11.6 | −19.2 | −2.6 | −22.5 |
| 22:00 to 23:00 | −8.7 | −17.6 | −0.6 | −13.9 |
| 23:00 to 00:00 | −5.0 | −13.1 | 1.7 | −6.7 |
Negative prices also occur less often, especially around midday. At 13:00 the share of negative quarters falls from 30.3% to 19.2%. For comparison: day-ahead was negative in 17.9% of quarters between 11:00 and 16:00.
Share of quarters with a negative imbalance price, per hour
% of quarters, Belgian time, 1 January to 31 July 2026.
Table per hour
| Hour | Current | New |
|---|---|---|
| 00:00 to 01:00 | 2.8% | 4.8% |
| 01:00 to 02:00 | 2.3% | 2.9% |
| 02:00 to 03:00 | 2.7% | 3.9% |
| 03:00 to 04:00 | 3.8% | 4.4% |
| 04:00 to 05:00 | 4.2% | 4.8% |
| 05:00 to 06:00 | 3.4% | 3.9% |
| 06:00 to 07:00 | 2.7% | 3.1% |
| 07:00 to 08:00 | 3.1% | 2.0% |
| 08:00 to 09:00 | 6.5% | 2.7% |
| 09:00 to 10:00 | 10.4% | 6.2% |
| 10:00 to 11:00 | 18.6% | 9.8% |
| 11:00 to 12:00 | 22.5% | 11.6% |
| 12:00 to 13:00 | 23.8% | 14.4% |
| 13:00 to 14:00 | 30.3% | 19.2% |
| 14:00 to 15:00 | 24.4% | 15.7% |
| 15:00 to 16:00 | 18.6% | 12.7% |
| 16:00 to 17:00 | 12.9% | 7.3% |
| 17:00 to 18:00 | 8.6% | 6.7% |
| 18:00 to 19:00 | 4.4% | 3.2% |
| 19:00 to 20:00 | 1.4% | 1.2% |
| 20:00 to 21:00 | 0.8% | 1.5% |
| 21:00 to 22:00 | 1.7% | 2.5% |
| 22:00 to 23:00 | 1.4% | 2.1% |
| 23:00 to 00:00 | 3.8% | 4.4% |
What it means for batteries and solar panels
For anyone settled on imbalance, value shifts from the evening to midday. Two worked examples make that concrete. They use fixed assumptions and are not a forecast for a specific installation. Grid tariffs, supplier fees and efficiency losses are not included.
A battery that sells in the evening
1 MWh per evening, at most 500 kW, between 17:00 and 23:00, over 212 days. Revenue per MWh sold:
| Scenario | Current | New |
|---|---|---|
| Planned and settled on day-ahead | €166.5 | €166.5 |
| Planned on day-ahead, settled on imbalance | €155.0 (−7%) | €138.0 (−17%) |
| The best quarters, with perfect knowledge of the imbalance price (upper bound) | €188.3 (+13%) | €180.6 (+8%) |
An evening sale that is simply settled on imbalance loses more under the new formula than today. The upper bound drops too. Anyone discharging a battery on imbalance in the evening will have to steer more sharply to earn the same.
Solar panels injecting on imbalance
1 MWh per day, spread over a solar profile from 9:00 to 18:00. Revenue per MWh offered:
| Scenario | Current | New |
|---|---|---|
| Day-ahead, curtailed at a negative price | €58.0 | €58.0 |
| Imbalance, without curtailment | €47.8 | €70.0 |
| Imbalance, curtailed at every negative price (upper bound) | €71.0 | €79.8 |
Without curtailment, 6 April weighs heavily. Leave that day out and it becomes 63.7 €/MWh under the current formula and 74.6 €/MWh under the new one. Curtailing on the imbalance price remains necessary: the new formula also gave up to −6,573 €/MWh on that day.
Caveats
- Elia calls the simulation "best effort" and not validated. The current prices in this comparison are validated.
- The simulation applies the new formula to historical data. As soon as market parties respond to the new price, the outcome changes too.
- The simulation contains a few striking quarters. On 18 June at 13:00 it gives 7,834 €/MWh, where the current formula gave 33 €/MWh.
- The introduction depends on approval by the CREG. On 17 November Elia removes the simulation, so real and simulated data do not get mixed. From 24 November at 10:00 Elia publishes live prices with the new formula.
Sources and method
- Current imbalance price per quarter: Elia Open Data, ODS134.
- New imbalance price per quarter (simulation): Elia Open Data, ODS212. This is also where the go-live date and the definition of each component are published.
- Belgian day-ahead price per quarter: Energy-Charts (Fraunhofer ISE).
- Period: quarters from 1 January to 31 July 2026 inclusive in UTC, 20,352 in total, with no missing values. Hours in the charts are in Belgian time.
- Evening and midday: daily average from 17:00 to 23:00 and from 10:00 to 16:00. The worked examples cover the 212 days of the period.
Voltmasters' own analysis of public data from Elia and Energy-Charts.